Download
1 / 10
100 likes | 250 Views
Between Groups & Within-Groups ANOVA. How F is “constructed” Things that “influence” F Confounding Inflated within-condition variability Integrating “stats” & “methods”. ANOVA AN alysis O f VA riance Variance means “variation”

E N D
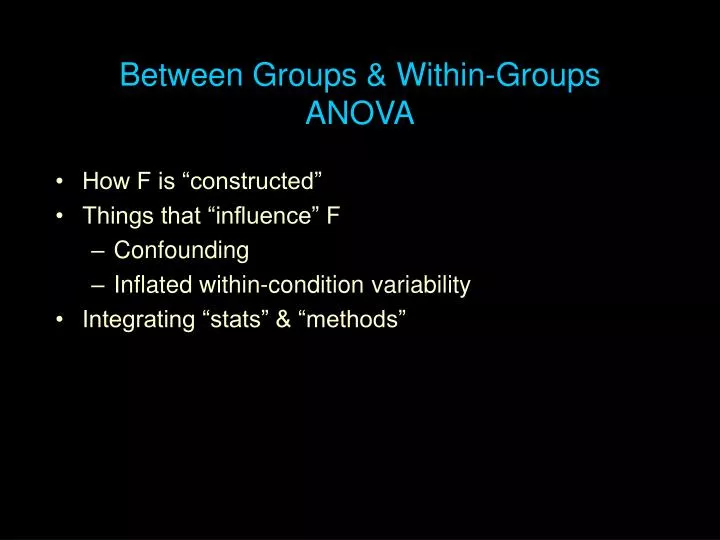
Between Groups & Within-Groups ANOVA • How F is “constructed” • Things that “influence” F • Confounding • Inflated within-condition variability • Integrating “stats” & “methods”
ANOVA ANalysis Of VAriance • Variance means “variation” • Sum of Squares (SS) is the most common variation index • SS stands for, “Sum of squared deviations between each of a set of values and the mean of those values” • SS = ∑ (value – mean)2 • So, Analysis Of Variance translates to “partitioning of SS” • In order to understand something about “how ANOVA works” we need to understand how BG and WG ANOVAs partition the SS differently and how F is constructed by each.
Variance partitioning for a BG design Called “error” because we can’t account for why the folks in a condition -- who were all treated the same – have different scores. Tx C 20 30 10 30 10 20 20 20 Mean 15 25 Variation among all the participants – represents variation due to “treatment effects” and “individual differences” Variation among participants within each condition – represents “individual differences” Variation between the conditions – represents variation due to “treatment effects” SSTotal= SSEffect + SSError
How a BG F is constructed Mean Square is the SS converted to a “mean” dividing it by “the number of things” SSTotal= SSEffect + SSError dfeffect = k - 1 represents # conditions in design MSeffect SSeffect / dfeffect F = = SSerror / dferror MSerror dferror = ∑n - k represents # participants in study
How a BG r is constructed r2 = effect / (effect + error) conceptual formula = SSeffect / ( SSeffect + SSerror) definitional formula = F / (F + dferror) computational forumla MSeffect SSeffect / dfeffect F = = SSerror / dferror MSerror
An Example … SStotal = SSeffect + SSerror 1757.574 = 605.574 + 1152.000 r2 = SSeffect / ( SSeffect + SSerror ) = 605.574 / ( 605.574 + 1152.000 ) = .34 r2 = F / (F + dferror) = 9.462 / ( 9.462 + 18) = .34
ANOVA assumes there are no confounds, and that the individual differences are the only source of within-condition variability SSeffect / dfeffect BGSSTotal= SSEffect + SSError F = SSerror / dferror A “more realistic” model of F IndDif individual differences BGSSTotal= SSEffect + SSconfound + SSIndDif + SSwcvar SSconfound between conditionvariability caused by anything(s) other than the IV (confounds) SSwcvar inflated within condition variability caused by anything(s) other than “natural population individual differences”
Imagine an educational study that compares the effects of two types of math instruction (IV)uponperformance (% - DV) Participants were randomly assigned to conditons, treated, then allowed to practice (Prac) as many problems as they wanted to before taking the DV-producing test Control GrpExper. Grp PracDV PracDV S15 75 S210 82 S35 74 S4 1084 S51078 S615 88 S71079S8 1589 • IV • compare Ss 5&2 - 7&4 • Confounding due to Prac • mean prac dif between cond • WG variability inflated by Prac • wg corrrelation or prac & DV • Individual differences • compare Ss 1&3, 5&7, 2&4, or 6&8
The problem is that the F-formula will … • Ignore the confounding caused by differential practice between the groups and attribute all BG variation to the type of instruction (IV) overestimating the effect • Ignore the inflation in within-condition variation caused by differential practice within the groups and attribute all WG variation to individual differences overestimating the error • As a result, the F & r values won’t properly reflect the relationship between type of math instruction and performance we will make a statistical conclusion error ! • Our inability to procedurally control variables like this will lead us to statistical models that can “statistically control” them SSeffect / dfeffect F = r = F / (F + dferror) SSerror / dferror
How research design impacts F integrating stats & methods! SSeffect / dfeffect SSTotal =SSEffect+SSconfound+SSIndDif+SSwcvar F = SSerror / dferror SSEffect “bigger” manipulations produce larger mean difference between the conditions larger F • SSconfound between group differences – other than the IV -- change mean difference changing F • if the confound “augments” the IV F will be inflated • if the confound “counters” the IV F will be underestimated SSIndDif more heterogeneous populations have larger within- condition differences smaller F • SSwcvar within-group differences – other than natural individual differences smaller F • could be “procedural” differential treatment within-conditions • could be “sampling” obtain a sample that is “more heterogeneous than the target population”