Download
1 / 80
840 likes | 1.17k Views
Principles of Epidemiology for Public Health (EPID600). Epidemiologic measures: Incidence & prevalence. Victor J. Schoenbach, PhD home page Department of Epidemiology Gillings School of Global Public Health University of North Carolina at Chapel Hill www.unc.edu/epid600/. Famous last words.

E N D
Principles of Epidemiology for Public Health (EPID600) Epidemiologic measures: Incidence & prevalence Victor J. Schoenbach, PhD home page Department of EpidemiologyGillings School of Global Public HealthUniversity of North Carolina at Chapel Hill www.unc.edu/epid600/ Incidence and prevalence
Famous last words Quotations that demonstrate the value of humility about predicting the future(authenticity not established) Courtesy of Suzanne Cloutier, 11/17/1998 Incidence and prevalence
“Louis Pasteur's theory of germs is ridiculous fiction.” - Pierre Pachet, Professor of Physiology at Toulouse, 1872 FAMOUS LAST WORDS: quotations that demonstrate the value of humility in predicting the future Incidence and prevalence
“This `telephone´ has too many shortcomings to be seriously considered as a means of communication. The device is inherently of no value to us.” - Western Union internal memo, 1876 (Source: 2000 National Ernst & Young Entrepreneur of the Year Awards special insert in USA Today, 2/11/2000, p9B) FAMOUS LAST WORDS: quotations that demonstrate the value of humility in predicting the future Incidence and prevalence
“Everything that can be invented has been invented.” - Charles H. Duell, Commissioner, US Patent Office,1899 FAMOUS LAST WORDS: quotations that demonstrate the value of humility in predicting the future Incidence and prevalence
“The wireless music box has no imaginable commercial value. Who would pay for a message sent to nobody in particular?” - David Sarnoff's associates in response to his urgings for investment in radio in the 1920s. FAMOUS LAST WORDS: quotations that demonstrate the value of humility in predicting the future Incidence and prevalence
“My thesis in this lecture is that macroeconomics . . . has succeeded: Its central problem of depression-prevention has been solved, for all practical purposes, and has in fact been solved for many decades.” - Robert E. Lucas, Jr., American Economics Association Presidential Address, January 10, 2003http://home.uchicago.edu/~sogrodow/homepage/paddress03.pdf FAMOUS LAST WORDS: quotations that demonstrate the value of humility in predicting the future Incidence and prevalence
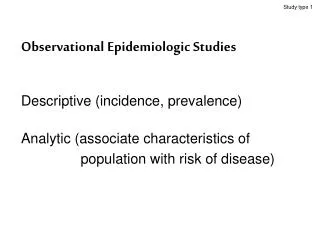
The population perspective requires measuring disease in populations • Science is built on classification and measurement. • Reality is infinitely detailed, infinitely complex. • Classification and measurement seek to capture the essential attributes. Incidence and prevalence
Deriving meaning from stimuli Vase or faces? Which line is longer? Incidence and prevalence
Measurement “captures” the phenomenon • Classification and measurement are based on: • Objective of the classification • Conceptual model (understanding of the phenomenon) • Availability of data (technology) Incidence and prevalence
An example population (N=200) O O O O O O O Incidence and prevalence
How can we quantify disease in populations? O Incidence and prevalence
How can we quantify disease in populations? O O Incidence and prevalence
How can we quantify disease in populations? O O O Incidence and prevalence
How can we quantify disease in populations? O O O O O Incidence and prevalence
How can we quantify disease in populations? O O O O O O Incidence and prevalence
How can we quantify the frequency? O O O O O O Incidence and prevalence
Rate of occurrence of new casesper unit time (e.g., 1 per month) O O O O O O Incidence and prevalence
1 new case in month 1 O Incidence and prevalence
1 new case in month 2 O O Incidence and prevalence
1 new case in month 3, for a total of 3 cases O O O Incidence and prevalence
2 new cases in month 4 O O O O O Incidence and prevalence
1 new case in month 5 (total=6) O O O O O O Incidence and prevalence
1 case in month 6 O O O O O O O Incidence and prevalence
1 new case in month 7 O O O O O O O O Incidence and prevalence
2 new cases in month 8 O O O O O O O O O O Incidence and prevalence
2 cases in month 9 O O O O O O O O O O O O Incidence and prevalence
Rate of occurrence of new cases during 9 months: 1 case/month to 2 cases/month O O O O O O O O O O O O Incidence and prevalence
Number of cases depends on length of interval Divide by length of time interval, so can compare across intervals Number of new casesRate of new cases = ––––––––––––––––– Time interval = 12 cases / 9 months = 1.33 cases / month Incidence and prevalence
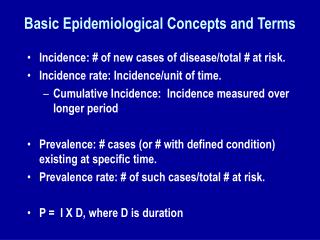
Number of cases depends on population size So, divide by population and time: Number of new casesIncidence rate = –––––––––––––––––– Population-time Incidence and prevalence
How to estimate population-time? Population at risk: the people eligible to become a case and to be counted as one. In this example that population declines as each case occurs. So estimate population-time as . . . Incidence and prevalence
Population-time = Method 1: Add up the time that each person is at risk Method 2: Add up the population at risk during each time segment Method 3: Multiply the average size of the population at risk by the length of the time interval Incidence and prevalence
Estimating population-time - method 2 Total population-time over 9 months = 200 + 199 + 198 + 197 + 195 + 194 + 193 + 192 + 190 = 1,758 person-months = 146.5 person-years However, cases are not at risk for a full month. Incidence and prevalence
Estimating population-time - method 2 - better Total population-time over 9 months = 199.5 + 198.5 + 197.5 + 196 + 194.5 + 193.5 + 192.5 + 191 + 189 = 1,752 person-months = 146 person-years assuming that cases develop, on average, in the middle of the month Incidence and prevalence
Estimating population-time - method 3 Average size of the population at risk during the 9 months = 195.3 (1,758 / 9) or approximately: (200 + 188) /2 = 194 Population-time = 195.3 x 9 months or (approximately) 194 x 9 months = 1,746 person-months = 145.5 person-years Incidence and prevalence
Equivalent to - method 3 Take initial size of population at risk and reduce it for time the people were not at risk due to acquiring the disease: 200 - 12/2 = 194 (approximately) Population-time = 194 x 9 months = 1,746 person-months = 145.5 person-years Incidence and prevalence
Incidence rate (“incidence density”) Number of new cases –––––––––––––––––––––––––––––––Avg population at risk × Time interval Number of new cases = –––––––––––––––––––– Population-time Incidence and prevalence
What proportion of the population at risk are affected after 5 months? O O O O O O O Incidence and prevalence
What proportion of the population is affected after 1 month? (1/200) O Incidence and prevalence
What proportion of the population is affected after 2 months? (2/200) O O Incidence and prevalence
What proportion of the population is affected after 3 months? (3/200) O O O Incidence and prevalence
What proportion of the population is affected after 4 months? (5/200) O O O O O Incidence and prevalence
6 / 200 = 0.03 = 3% = 30 / 1,000 in 5 months O O O O O O Incidence and prevalence
Incidence proportion (“cumulative incidence”) Number of new cases5-month CI = ––––––––––––––––––– Population at risk Incidence proportion estimates risk. Incidence and prevalence
Incidence rate versus incidence proportion • Incidence rate measures how rapidly cases are occurring. • Incidence proportion is cumulative. • When care only about the “bottom line” (i.e., what has happened by the end of given period): incidence proportion (CI). Incidence and prevalence
Incidence rate versus incidence proportion • If risk period is long (e.g., cancer), we usually observe only a portion. • To compare results from studies with different length of follow-up, use incidence rate (IR) • If risk period is short, we usually observe all of it and can use incidence proportion. Incidence and prevalence
Incidence rate versus incidence proportion(rare disease, IR = 0.005 / month) (see spreadsheet at epidemiolog.net/studymat/) Incidence and prevalence
Incidence rate versus incidence proportion (common disease, IR = 0.1 / month) Incidence and prevalence
Case fatality rate • “Case fatality rate” (but it’s really a proportion) • = proportion of cases who die (in a specified time interval) • Like a “cumulative incidence of death” in cases[ “incidence rate of death” in cases = “termination rate” = 1/(average survival time)] Incidence and prevalence
Mortality rate Number of deathsMortality rate = –––––––––––––––––––––––––––– Population at risk × Time interval Number of deathsAnnual mortality rate = –––––––––––––––––––––– Mid-year population (x 1 yr) Incidence and prevalence