Download
1 / 17
220 likes | 742 Views
Study of Intraclass Correlation Coefficient Method in a Measurement System. E ng . Juan Ignacio Ruiz Guerrero, M.C. Manuel Darío Hernández Ripalda , Ph.D . Salvador Echeverría-Villagómez, M.C. Moises Tapia- Esquivias . Introduction. COMPARISON METHOD. Problems. VARIATION SOURCE.

E N D
Study of IntraclassCorrelationCoefficientMethod in a MeasurementSystem Eng. Juan Ignacio Ruiz Guerrero, M.C. Manuel Darío Hernández Ripalda, Ph.D. Salvador Echeverría-Villagómez, M.C. MoisesTapia-Esquivias.
Introduction COMPARISON METHOD
Problems VARIATION SOURCE
Gage R&R Gage R & R is a system that is combined with variation of repeatability and reproducibility. Otherwise, GRR equals the sum variation in the system and change between systems (11). Ec. 1 Gagereproducibility & repeatability(Wheeler, 2011) Fig. 2 Reproducibility (Reyes) Fig. 1Repeatability (Reyes)
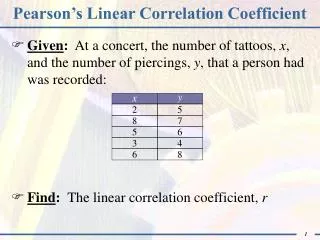
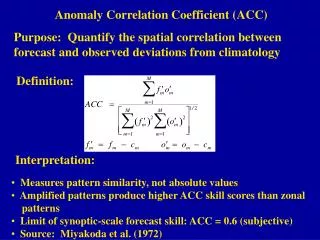
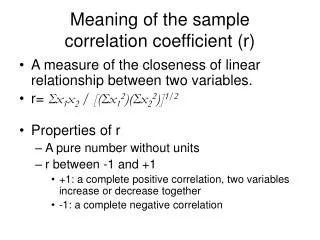
2. Theoretical Framework 2.1 Intraclass correlation coefficient The correlation coefficient is defined as the proportion of the variation in the measurements of the product that can be attributed to the product stream, and is the complement of the ratio of the variation in the measurements of the product that can be attributed to the system measurement (3). Ec.2 Intraclass correlation coefficient (7).
2.2 Number of distinct categories (NDC). This is defined as the number of non-overlapping confidence intervals of 97% for the true value of the property as they cross the variation of the expected product. NDC can be distinguished reliably from the measurement system. NDC value is truncated to give an integer. The AIAG rule is that the NDC must be at least 5 for the measurement system may be acceptable. . The formula proposed by AIAG used, for example, in MINITAB can be written as (8): Ec. 3 Number of distinct categories, (9).
2.3 Anova 2.3.1 Measurementvariation in tree OverallVariation Measurement System Variation Part-to-Part Variation Variation due to Operators Variation due to Gage Reproducibility Repeatability Operator by Part Operators
3. Method description 3.1 Data Generation Process • Based on the above values are calculated from the variation in the following manner using the equation of the number of distinct categories: Table 1. Values of the variation in part.
3.2 Gage R&R in Measurement System Software like Minitab to perform the GR&R study by the ANOVA method simultaneously estimates the NDC and ICC, this can be read respectively in the window session of the program, such as "Number of Categories Different" and "Percentage of Contribution" part to part Number of distinct categories = 1
4. Development Thirty cases were generated in each of the categories with a DIST.NORM INV (PROBABILITY (), MEAN0, STD); using Excel, subsequently were entered into Minitab to perform the GR&R. Values of NDC must be greater than 5 Values of ICC must be greater than 0.80
4.1 Confidence intervals To generate confidence intervals [3] for each of the categories, Minitab is uses in order to perform sampling using the values obtained in columns the number of categories and values obtained from the ICC. These 30 columns of data are placed into Minitab. 5. Results According to the confidence intervals of the average obtained is observed that the values by ndc have greater uncertainty for the 3 categories, but the major difference is generated in the category of acceptance. Table 3. Confidence intervals for the mean for all categories.
Concluding Remarks The current AIAG Measurement System punishes or penalizes too the measurement systems, a correct system could be rejected. This affects the Auto Industry who are governed by the AIAG methodology which involves the revision of the standard in automotive industry operates. Summary of results In this research we studied measurement methods, measurement GR&R of AIAG and intraclass correlation coefficient as proposed by Wheeler, which shows differences and similarities of the methods, they are different in their standard to qualify, as AIAG penalizes more rigor measurement systems while Wheeler method tends to rate measurement systems really acceptable. Conclusions By comparing the method AIAG and Wheeler method, one can conclude that the method estimates AIAG results with high values. The GR&R method attenuates actually AIAG variation measuring system instead of the production process. From this study, the method of Wheeler is recommended on the AIAG method, as the measurements obtained from AIAG are inflated, they overestimate the components of measurement error in a study coinciding with (10).
References 1. AIAG.Analisis de los sistemas de medición. s.l. : AIAG, 2010. 2. K. Burdick, Richard, M. Borror, Connie y C. Montgomery, Douglas.Desing and Analysis of Gage R&R Studies. Philadelphia, Pennsylvania. : Board, 2005. 3. Wheeler, Donald J. The Intraclass Correlation Coefficient. Qualitydigest. [En línea] 02 de 12 de 2010. [Citado el: 19 de 03 de 2012.] http://www.qualitydigest.com/inside/twitter-ed/intraclass-correlation-coefficient.html. 4. Montgomery, Douglas C. y Runger, George C.Probabilidad y estadística aplicadas a la Ingeniería. México, D.F. : Mc GRAW HILL INTERAMERICANA EDITORES,S.A de C.V., 2005. 5. Mosquera Saravia, Cristián Rodrigo. Comparación entre los Métodos de evaluación de incertidumbre y estudios de repetibilidad y reproducibilidad para la evaluación de las mediciones. Comparación entre los Métodos de evaluación de incertidumbre y estudios de repetibilidad y reproducibilidad para la evaluación de las mediciones. [En línea] 03 de 2007. [Citado el: 1 de 03 de 2012.] http://biblioteca.usac.edu.gt/tesis/08/08_0105_MT.pdf. 6. Romeo Olea, Daniel. Metodología para la implementación de la planeación avanzada de la calidad del producto en la industria metal mecánica. Instituto Politecnico Nacional, Escuela superior de ingeniería mecánica y eléctrica, Unidad profesional Azcapotzalco. [En línea] 28 de 04 de 2008. [Citado el: 20 de 10 de 2012.] http://itzamna.bnct.ipn.mx:8080/dspace/bitstream/123456789/187/1/TESIS%20APQP%20DANIEL%20RO.pdf.
References • 7. Wheeler, Donald. J. A Better Way to Do R&R Studies. qualitydigest. [En línea] 01 de 02 de 2011. [Citado el: 25 de 04 de 2012.] • http://www.qualitydigest.com/inside/twitter-ed/better-way-do-rr-studies.html. • 8. Woodall, William H. y Borror, Connie M. Some Relationships between Gage R&RCriteria. Quality and ReliabilityEngineering International. [En línea] 19 de 06 de 2007. [Citado el: 1 de 11 de 2012.] http://www.iem.yuntech.edu.tw/home/lab/qre/Courses/2/AQM-2/files/962%E9%AB%98%E5%93%81%E7%AE%A1ppt%E8%AC%9B%E7%BE%A9/Gage_RR_criteria.pdf. • 9. Minitab. Versión (16.1.1). [Software de computo]. Pensilvania, Pensilvania, EEUU : Minitab Inc., 2010. • 10. Pandiripalli, Bhavani. Repeatability y Reproducibility studies: A comparison of techniques. Wichita State University, College of Engineering, Dept. of Industrial and Manufacturing Engineering. [En línea] 2010. [Citado el: 5 de 01 de 2013.] • http://soar.wichita.edu/bitstream/handle/10057/3736/t10107_Pandiripalli.pdf?sequence=1. • 11. Fernández & Exiga, Sistemas y Análisis de medición (MSA). Gestiopolis. [En línea] 2006. [Citado el: 20 de 10 de 2012]. • http://www.gestiopolis1.com/recursos7/Docs/ger/medicion-del-desempeno-y-rendimiento.htm.
Thanksforyourattention 2013 Year of statistics Eng. Juan Ignacio Ruiz-Guerrero, nacho_got@hotmail.com M.C. Manuel Darío Hernández-Ripalda, buzonmdhr@yahoo.com.mx Ph.D. Salvador Echeverría-Villagómez, saleche@cenam.mx M.C. Moises Tapia-Esquivias, moises.tapia@itcelaya.edu.mx