Download
1 / 1
10 likes | 219 Views
Optical and Radiative Properties of Aerosols. over Puerto Rico using a. Multifilter Rotating Shadow-band Radiometer. Yaítza Luna 1 , Mark Chang 2 , Roy Armstrong 3 and Yasmín Detrés 3.

E N D
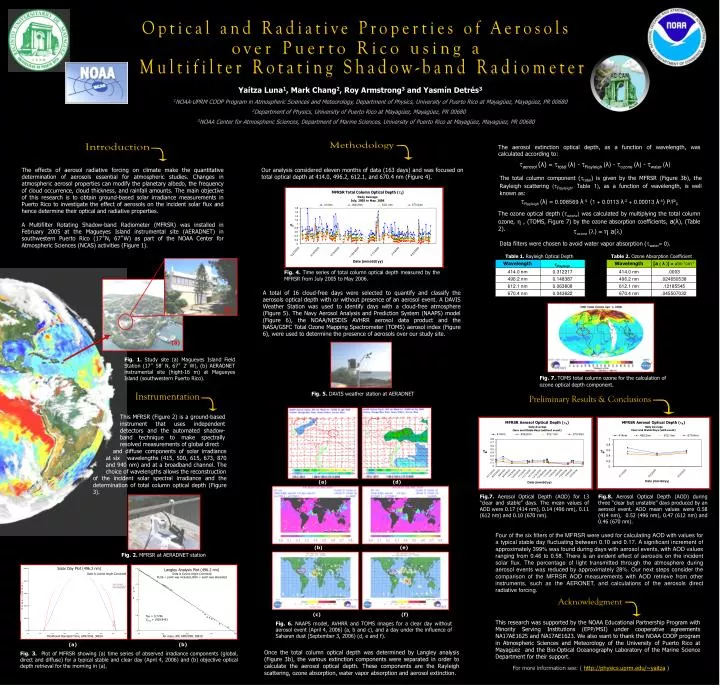
Optical and Radiative Properties of Aerosols over Puerto Rico using a Multifilter Rotating Shadow-band Radiometer Yaítza Luna1, Mark Chang2, Roy Armstrong3 and Yasmín Detrés3 1NOAA-UPRM COOP Program in Atmospheric Sciences and Meteorology, Department of Physics, University of Puerto Rico at Mayagüez, Mayagüez, PR 00680 2Department of Physics, University of Puerto Rico at Mayagüez, Mayagüez, PR 00680 3NOAA Center for Atmospheric Sciences, Department of Marine Sciences, University of Puerto Rico at Mayagüez, Mayagüez, PR 00680 The effects of aerosol radiative forcing on climate make the quantitative determination of aerosols essential for atmospheric studies. Changes in atmospheric aerosol properties can modify the planetary albedo, the frequency of cloud occurrence, cloud thickness, and rainfall amounts. The main objective of this research is to obtain ground-based solar irradiance measurements in Puerto Rico to investigate the effect of aerosols on the incident solar flux and hence determine their optical and radiative properties. A Multifilter Rotating Shadow-band Radiometer (MFRSR) was installed in February 2005 at the Magueyes Island instrumental site (AERADNET) in southwestern Puerto Rico (17˚N, 67˚W) as part of the NOAA Center for Atmospheric Sciences (NCAS) activities (Figure 1). Our analysis considered eleven months of data (163 days) and was focused on total optical depth at 414.0, 496.2, 612.1, and 670.4 nm (Figure 4). Introduction Instrumentation Methodology Acknowledgment Table 1. Rayleigh Optical Depth Table 2. Ozone Absorption Coefficient Wavelength tRayleigh Wavelength [a (λ )] = atm-1cm-1 414.0 nm 0.312217 414.0 nm .0003 496.2 nm 0.148387 496.2 nm .024650538 Fig. 4. Time series of total column optical depth measured by the MFRSR from July 2005 to May 2006. 612.1 nm 0.063808 612.1 nm .12185545 670.4 nm 0.043622 670.4 nm .045507032 (b) (a) (a) Fig. 7. TOMS total column ozone for the calculation of ozone optical depth component. Fig. 1. Study site(a) Magueyes Island Field Station (17˚ 58’ N, 67˚ 2’ W), (b) AERADNET instrumental site (hight-16 m) at Magueyes Island (southwestern Puerto Rico). Preliminary Results & Conclusions Fig. 5. DAVIS weather station at AERADNET This MFRSR (Figure 2) is a ground-based instrument that uses independent detectors and the automated shadow-band technique to make spectrally resolved measurements of global direct and diffuse components of solar irradiance at six wavelengths (415, 500, 615, 673, 870 and 940 nm) and at a broadband channel. The choice of wavelengths allows the reconstruction of the incident solar spectral irradiance and the determination of total column optical depth (Figure 3). (a) (d) Fig.7. Aerosol Optical Depth (AOD) for 13 “clear and stable” days. The mean values of AOD were 0.17 (414 nm), 0.14 (496 nm), 0.11 (612 nm) and 0.10 (670 nm). Fig.8. Aerosol Optical Depth (AOD) during three “clear but unstable” days produced by an aerosol event. AOD mean values were 0.58 (414 nm), 0.52 (496 nm), 0.47 (612 nm) and 0.46 (670 nm). (b) (e) Solar Day Plot (496.2 nm) Data is Cosine Angle Corrected Langley Analysis Plot (496.2 nm) Data is Cosine Angle Corrected PLUS = point was kept, BOX = point was thrown away Langley Analysis Plot (496.2 nm) Data is Cosine Angle Corrected PLUS = point was included, BOX = point was discarded Fig. 2. MFRSR at AERADNET station Direct Normal Diffuse Horizontal Total Horizontal I RRADIANCE L n I Tau = 0.7746 Vzero = 1929.9451 (c) (f) Meridional Standard Time, APR/4/06, 38810 Air mass, AM, APR/4/06, 38810 Fig. 6. NAAPS model,AVHRR and TOMS images for a clear day without aerosol event (April 4, 2006) (a, b and c), and a day under the influence of Saharan dust (September 3, 2006) (d, e and f). (a) (b) Fig. 3. Plot of MFRSR showing(a) time series of observed irradiance components (global, direct and diffuse) for a typical stable and clear day (April 4, 2006) and (b) objective optical depth retrieval for the morning in (a). The aerosol extinction optical depth, as a function of wavelength, was calculated according to: aerosol (λ) = total (λ) - Rayleigh (λ) - ozone (λ) - water (λ) The total column component (total) is given by the MFRSR (Figure 3b), the Rayleigh scattering (Rayleigh, Table 1), as a function of wavelength, is well known as: Rayleigh (λ)= 0.008569 λ-4(1 + 0.0113 λ-2+ 0.00013 λ-4) P/P0 The ozone optical depth (ozone) was calculated by multiplying the total column ozone, , (TOMS, Figure 7) by the ozone absorption coefficients, a(λ), (Table 2). ozone()=a() Data filters were chosen to avoid water vapor absorption (water= 0). A total of 16 cloud-free days were selected to quantify and classify the aerosols optical depth with or without presence of an aerosol event. A DAVIS Weather Station was used to identify days with a cloud-free atmosphere (Figure 5). The Navy Aerosol Analysis and Prediction System(NAAPS) model (Figure 6), the NOAA/NESDIS AVHRR aerosol data product and the NASA/GSFC Total Ozone Mapping Spectrometer (TOMS) aerosol index (Figure 6), were used to determine the presence of aerosols over our study site. Four of the six filters of the MFRSR were used for calculating AOD with values for a typical stable day fluctuating between 0.10 and 0.17. A significant increment of approximately 399% was found during days with aerosol events, with AOD values ranging from 0.46 to 0.58. There is an evident effect of aerosols on the incident solar flux. The percentage of light transmitted through the atmosphere during aerosol events was reduced by approximately 28%. Our next steps consider the comparison of the MFRSR AOD measurements with AOD retrieve from other instruments, such as the AERONET, and calculations of the aerosols direct radiative forcing. This research was supported by the NOAA Educational Partnership Program with Minority Serving Institutions (EPP/MSI) under cooperative agreements NA17AE1625 and NA17AE1623. We also want to thank the NOAA COOP program in Atmospheric Sciences and Meteorology of the University of Puerto Rico at Mayagüez and the Bio-Optical Oceanography Laboratory of the Marine Science Department for their support. Once the total column optical depth was determined by Langley analysis (Figure 3b), the various extinction components were separated in order to calculate the aerosol optical depth. These components are the Rayleigh scattering, ozone absorption, water vapor absorption and aerosol extinction. For more information see: ( http://physics.uprm.edu/~yaitza)