Download
1 / 21
220 likes | 523 Views
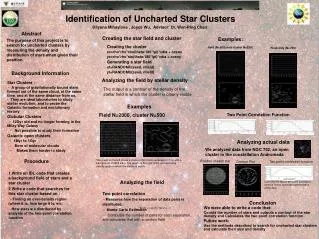
Identification of Knowledge and Innovation Clusters: A GIS Application. Presentation by: Hamilton Galloway Economic Modeling Specialists, Inc. Spirit of Innovation Forum III May 16, 2008. Paper by: Hamilton Galloway and Henry Robison. Introduction.

E N D
Identification of Knowledge and Innovation Clusters: A GIS Application Presentation by: Hamilton Galloway Economic Modeling Specialists, Inc. Spirit of Innovation Forum III May 16, 2008 Paper by: Hamilton Galloway and Henry Robison
Introduction This research takes a spatially descriptive look at innovation and the U.S. economic landscape with the objective of identifying measurable characteristics of innovative clusters. Presentation Layout: • Background • Variables • Methodology • Results • Conclusion • Future Research Note: This the data for this research was provided completely through the EMSI database, which uses advanced econometric and statistical procedures to estimate county-level suppressed data.
Reason for Research Growing need for research and study of regional innovation systems and economic development • First Step: Create methods to identify, categorize and evaluate innovative regions • Second Step: Determine regional characteristics and industry-occupational focuses • Third Step: Leverage the strengths of the region, fill the gaps where possible *This research focuses on Steps One and Two.
Background In the beginning… • Industrial Revolution (c. 1760) – Major changes in agriculture, manufacturing and transportation. Reduction in the traditional manual labor-based economy as machines increased output. • Agglomeration Economies (c. 1890) – Geographically locating similar industries to take advantage of economies of scale and network effects. • Industry Clusters (c. 1990) – Porter’s “idea” of co-locating interconnected and/or value-chain industries to take advantage of economies of scale (an extension of Alfred Marshall’s work). • Knowledge Clusters (c. 19??) – Paradigm shift from a product-based economy to a knowledge-based economy – Leading to Innovation. The Point: As developed economies face increased competitive pressure from developing economies, a focus on high-end output will help maintain our competitive advantage in a global economy. As a result, research into the components of knowledge-based industry clusters and regional development is relatively new and all avenues must be explored.
Definition of Knowledge Cluster Japan’s 2nd Science and Technology Basic Plan: “a technological innovation system formed through local initiative. At the center of the clusters is a unique R&D topic for the area, and core research institutions (like Universities) with high research potential. The system also involves the participation of corporations and other groups from both inside and outside the region.More specifically, the project forms human networks and joint research organizations to promote beneficial feedback between the ‘seeds’ of innovative technology possessed by public research organizations and other groups forming the core, and corporate needs for practicality. This creates a chain reaction of technical innovation, which eventually results in the creation of new industries [or expansion of current industries].” Do regions have to fit this narrow definition to meet the criteria of a knowledge cluster? Not necessarily.
Variables • High-Tech Industry Clusters (as defined by Purdue’s Center for Regional Development): identifies regions where high-tech industry exist, specifically where high relative concentrations (indicated by Location Quotients) of high tech industries exist. Specific Clusters: advanced materials, biomedical/biotechnical, chemicals, computers and electronics, electrical equipment and appliance, energy, IT/telecom, machinery manufacturing, transportation equipment and business/finance. Note: The presence of a high-tech industry doesn’t necessarily mean innovation is taking place.
Variables Con’t • High Knowledge Occupation Clusters: occupations that require significant amounts of education and training. The clusters represent commonly shared knowledge compositions such as bio-science, engineering and mathematics. Clusters were created using a hierarchical algorithm and 33 knowledge variables identified through O*NET and were limited to only Job Zone 4 & 5 occupations. Specific Clusters: architecture, biology, computer science, engineering, health, medical, physics, statistics, finance and management.
Variables Con’t • College and Graduate Degree Attainment: relates to high-knowledge occupations, but indicates the relative regional knowledge levels of the 25+ workforce. To this end, two variables (college attainment and graduate attainment) are used.
Variables Con’t • Patent Data: shows the current relative innovation output of a region. Data is based on the patents granted by the USPTO. • Higher Educational Institutions: though not measured, the variable allows one to see the geographic placement of higher-education research universities.
Methodology • Concentration: Geographically identify all areas of knowledge indicators. Counties with location quotients (LQs) higher than 1.2 (a significantly greater local share of a given indicator as compared to the national share for the same indicator) were identified.
Methodology • Co-Existence: Layers Specific Industry-Occupation pairs and evaluates where high-tech industries and high-knowledge occupations co-exist with high relative levels of patent generation. This was done for multiple different combinations of industry, occupations and educational attainment.
Methodology • Correlation, specifically spatial autocorrelation: Using an “innovation index” that combines all relative values of all the variables, a Getis-Ord Gi* statistic was calculated for all counties. The statistics measure the strength of regional innovation spatial relationships, giving more significance to nearer counties.
Results: Transportation Manf. And Engineering Occupation Co-Existence
Results: Innovation Index Ingredients Regional Strengths: advanced materials manufacturing, machine manufacturing, engineering occupations, biology occupations, educational attainment and patent generation. Specific Weaknesses: Linn County’s lower concentration of educational attainment and low concentration of most knowledge-based occupations and Marion County’s low concentration of all major industry clusters. Policy Option: Increase availability of educational opportunities in Linn County and focused recruitment of high-knowledge occupations; leverage high concentrations of statistics, biology and health occupations for industry recruitment in Marion County.
Conclusion • Methodology and results allow practitioners and policy makers an alternative way of viewing their economies. • Can easily pick out strengths and weaknesses as well as compare against other “similar” regions in a visual manner.
Next Steps • Develop regional dynamic components that track growth/decline in the variable. • Develop Industry Specific Occupational Clusters concentrations (using regionalized staffing patterns) to determine what industries “do” rather than “make”—Currently in Progress with PCRD. • Use GWR or some form of spatial regression to identify key variables that contribute more towards innovation growth. This will help prioritize regional investments and account for spatial heterogeneity.