Download
1 / 1
10 likes | 196 Views
J. HOVORKA 1 , M .B RANI Š 1 , J. SCHWARZ 2 h ovorka @ cesnet.cz , branis @natur.cuni.cz, schwarz@icpf.cas.cz 1 Institute for Environmental Studies, Faculty of Science, Charles University in Prague, Benátská 2, 128 01 Prague 2, Czech Republic

E N D
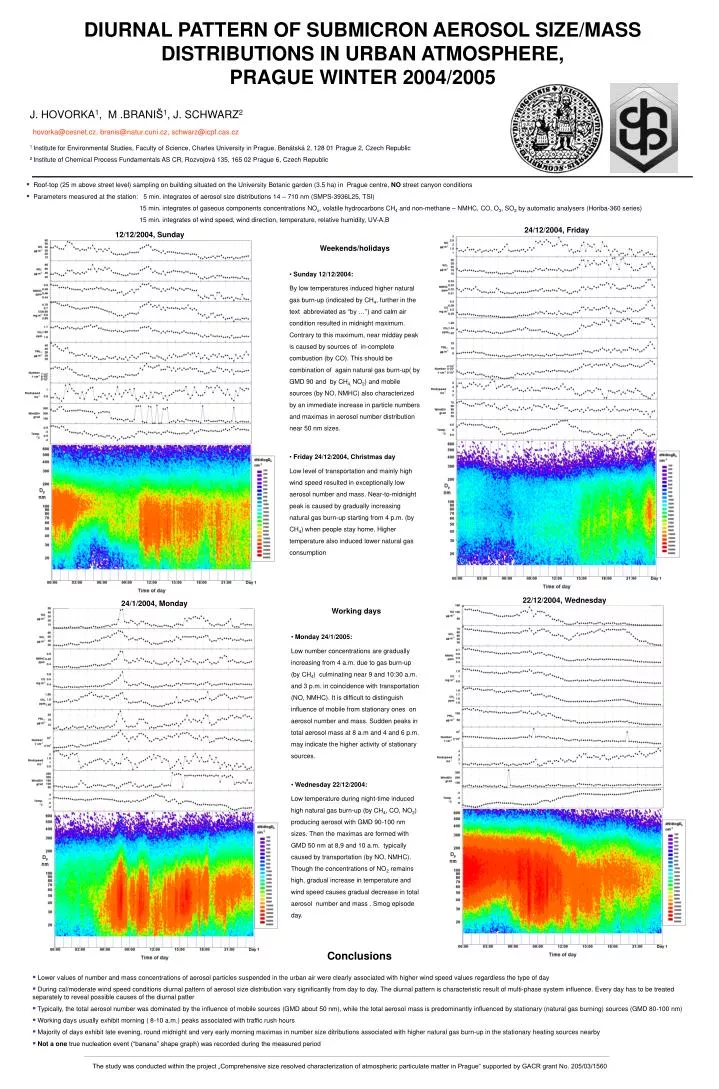
J. HOVORKA1, M .BRANIŠ1,J. SCHWARZ2 hovorka@cesnet.cz, branis@natur.cuni.cz, schwarz@icpf.cas.cz 1Institute for Environmental Studies, Faculty of Science, Charles University in Prague, Benátská 2, 128 01 Prague 2, Czech Republic 2Institute of Chemical Process Fundamentals AS CR, Rozvojová 135, 165 02 Prague 6, Czech Republic DIURNAL PATTERN OF SUBMICRON AEROSOL SIZE/MASS DISTRIBUTIONS IN URBAN ATMOSPHERE, PRAGUE WINTER 2004/2005 • Roof-top (25 m above street level) sampling on building situated on the University Botanic garden (3.5 ha) in Prague centre, NO street canyon conditions • Parameters measured at the station: 5 min. integrates of aerosol size distributions 14 – 710 nm (SMPS-3936L25, TSI) 15 min. integrates of gaseous components concentrations NOx, volatile hydrocarbons CH4 and non-methane – NMHC, CO, O3, SO2 by automatic analysers (Horiba-360 series) 15 min. integrates of wind speed, wind direction, temperature, relative humidity, UV-A,B 24/12/2004, Friday 12/12/2004, Sunday • Weekends/holidays • Sunday 12/12/2004: • By low temperatures induced higher natural gas burn-up (indicated by CH4, further in the text abbreviated as “by …”) and calm air condition resulted in midnight maximum. Contrary to this maximum, near midday peak is caused by sources of in-complete combustion (by CO). This should be combination of again natural gas burn-up( by GMD 90 and by CH4, NO2) and mobile sources (by NO, NMHC) also characterized by an immediate increase in particle numbers and maximas in aerosol number distribution near 50 nm sizes. • Friday 24/12/2004, Christmas day • Low level of transportation and mainly high wind speed resulted in exceptionally low aerosol number and mass. Near-to-midnight peak is caused by gradually increasing natural gas burn-up starting from 4 p.m. (by CH4) when people stay home. Higher temperature also induced lower natural gas consumption 22/12/2004, Wednesday 24/1/2004, Monday • Working days • Monday 24/1/2005: • Low number concentrations are gradually increasing from 4 a.m. due to gas burn-up (by CH4) culminating near 9 and 10:30 a.m. and 3 p.m. in coincidence with transportation (NO, NMHC). It is difficult to distinguish influence of mobile from stationary ones on aerosol number and mass. Sudden peaks in total aerosol mass at 8 a.m and 4 and 6 p.m. may indicate the higher activity of stationary sources. • Wednesday 22/12/2004: • Low temperature during night-time induced high natural gas burn-up (by CH4, CO, NO2) producing aerosol with GMD 90-100 nm sizes. Then the maximas are formed with GMD 50 nm at 8,9 and 10 a.m. typically caused by transportation (by NO, NMHC). Though the concentrations of NO2 remains high, gradual increase in temperature and wind speed causes gradual decrease in total aerosol number and mass . Smog episode day. 24/1/2005, Monday Conclusions • Lower values of number and mass concentrations of aerosol particles suspended in the urban air were clearly associated with higher wind speed values regardless the type of day • During cal/moderate wind speed conditions diurnal pattern of aerosol size distribution vary significantly from day to day. The diurnal pattern is characteristic result of multi-phase system influence. Every day has to be treated separately to reveal possible causes of the diurnal patter • Typically, the total aerosol number was dominated by the influence of mobile sources (GMD about 50 nm), while the total aerosol mass is predominantly influenced by stationary (natural gas burning) sources (GMD 80-100 nm) • Working days usually exhibit morning ( 8-10 a.m.) peaks associated with traffic rush hours • Majority of days exhibit late evening, round midnight and very early morning maximas in number size ditributions associated with higher natural gas burn-up in the stationary heating sources nearby • Not a one true nucleation event (“banana” shape graph) was recorded during the measured period The study was conducted within the project „Comprehensive size resolved characterization of atmospheric particulate matter in Prague“ supported by GACR grant No. 205/03/1560