1 / 3

Supplemental D ata Figure 1A

talen
Download Presentation

Supplemental D ata Figure 1A

An Image/Link below is provided (as is) to download presentation Download Policy: Content on the Website is provided to you AS IS for your information and personal use and may not be sold / licensed / shared on other websites without getting consent from its author. Content is provided to you AS IS for your information and personal use only. Download presentation by click this link. While downloading, if for some reason you are not able to download a presentation, the publisher may have deleted the file from their server. During download, if you can't get a presentation, the file might be deleted by the publisher.

E N D

Presentation Transcript


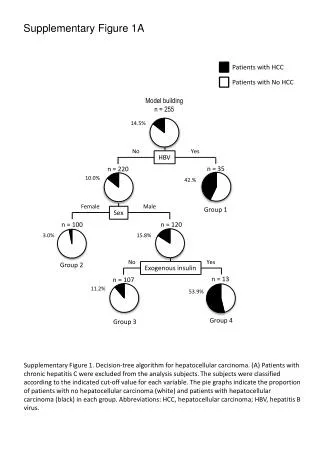
  1. Supplemental Data Figure 1 Impact of ‘run-in’ period on overall prevalence of tests requested a) ‘too soon’ and b) ‘too late’. Data on whether requests were ‘too soon’ or ‘too late’ were based on the date of the previous request. As the period covered in the search for this previous request increases, the estimate of prevalence of tests requested ‘too soon’ is relatively constant, while that for those requested ‘too late’ increases to a plateau. The impact of using a 2-year run-in on the latter period is highlighted with the hashed line in b).

  2. Supplemental Data Figure 1A

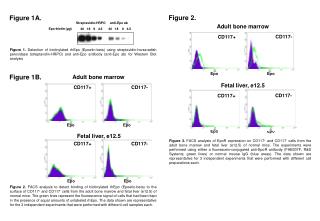
  3. Supplemental Data Figure 1B Estimate based on 2 year ‘run-in’ period

More Related