Download
1 / 18
180 likes | 286 Views
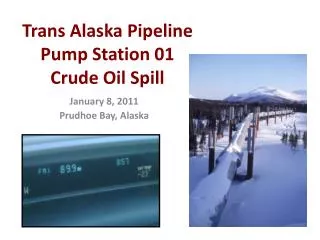
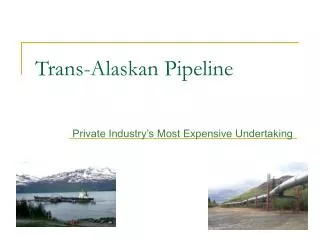
Experience with Data Integration on the Trans Alaska Pipeline. Alyeska Experience with Data Integration on Trans Alaska Pipeline. TAPS Background. 800 Mile - Crude Oil Transmission Pipeline North Slope to Valdez Alaska 48 “ Dia. 0.5” wall thickness Three Construction Modes to Consider

E N D
Experience with Data Integration on theTrans Alaska Pipeline Alyeska Experience with Data Integration on Trans Alaska Pipeline Data Integration
TAPS Background • 800 Mile - Crude Oil Transmission Pipeline • North Slope to Valdez Alaska • 48 “ Dia. 0.5” wall thickness • Three Construction Modes to Consider • 376 Miles Conventional Below Ground pipeline • 420 Miles Above Ground to avoid unstable permafrost • 4 Miles Insulated/Refrigerated Buried • System Startup - August 1977 • 24 Yrs of Operation • 2.1 MMBPD Capacity, 1.0 MMBPD Throughput • Over 13 B bbls transported Data Integration
TAPS ILI Background • TAPS - History of In Line Inspection (ILI) • Annual Inspections Since 1979 • 58 Smart Pig Runs over operating life • Both UT and MFL wall loss pigs used - UT is now primary tool • Curvature/Deformation Pigs used • Predominate Operating Risks Addressed by ILI • Corrosion • Settlement/Curvature • Deformation/Third Party damage - • During construction and operation Data Integration
Experience with Data Integration • Data Integration Depends on Decisions Required • Focus on Decision Support not just Data Management • A Management System needed - to manage changes • Decisions Based on Risk - Contain Uncertainty • Decisions depend on defect type • Corrosion, Dents, Curvature, Interaction of defects • Decisions depend on pipeline location and data limitations • High Risk v Normal Risk Locations • Intervention Criteria Based on Risk • Interaction with ILI Vendors a Must • Pig Data Can Be Used to Assess Cathodic Protection Data Integration
Data Integration Description • Oracle Data Base - Intranet Application- By Pipe Joint (Contains 105,000) • Pipe Data - Grade, Thickness, MAOP, Hydrotest data, Bend data, Mode • Pipe Features - Insulation, Casing, Coating, River Weights, etc, • Hydraulics Data - Functional MOP • Pig Data - Corrosion/Curvature/Deformation - Contains Graded, Not Raw Data, • CP Data - CIS, CP Coupon Data • Embeds Routine Queries and Decisions • Corrosion Defect Evaluations, RSTRENG • Outputs Routine Reports • Ranking by penetration, bursting pressure, SF, Years to Dig, Etc. • Integrated Data Displays - GIS not mandatory • Contains Information needed for Maintenance Decisions Data Integration
Management System Elements • A management system is needed to manage change • Alyeska Integrity Management System (AIMS) has 5 elements • Scope & Objectives defined • Secure, readily accessible environment • Allows Accurate and efficient maintenance decisions • Distributes data in a single source • Maintains a record of decisions made • Procedures written • Data Collection, Quality Assurance, Security etc. Data Integration
Mgmt System Elements (Cont) • Accountable Resources - Roles Defined • Data Base Developer • Data Base Administrator • Data Owners, Data Entry • System Users • IT Maintenance Support • Data Management Performance Measures established Based on Objectives • Feedback Processes established • AIMS Assessment - Improvement of Decision Support Management Plan • Risk Assessment - Assess risks e.g. bad algorithm, data corruption, human error • Technology Assessment - Take advantage of new technologies, i.e. GIS • Compliance Assessment - Adapt to new regulations, new industry standards • Business Assessment - Strategic planning and budgeting Data Integration
Defect Types and Failure Modes • Corrosion • Penetration • Bursting • Dents • Outside Force/Third Party Damage - Top Half of Pipe • Bottom Half of Pipe - • Dents w Stress Riser (Metal Loss or Contact with Weld) • Curvature and Curvature w Corrosion • Straight Pipe • Field Bends Data Integration
Risk Classification Sets Urgency • Decisions depend on Risk • Consequences depend on pipeline location • Data Limitations increase risks (pig data, CP data) • High Risk Areas - 6 different types • DOT High Consequence Areas ~ 40 miles • Locations where leak “Could Affect” • Commercially Navigable Waterways • High or Other Population Areas • Unusually Sensitive Areas - Endangered Species • Other (Discretionary) High Consequence Areas ~ 20 miles • Locations “Within” • Major Streams or Floodplains • Inaccessible Areas Data Integration
Action Urgency (Continued) • High Risk Areas (Continued) • Areas where Pig Performance is Limited ~ 15 miles • Near Welds, 3D Bends, Slack Line, Wax affected locations • Active Corrosion Areas - 9 miles • Statistically Active Corrosion, High projected corrosion • Areas with Limited Cathodic Protection - 5 miles • Under Insulation, Shorted Casings, Known Disbonded Coatings • Notably Corroded Areas - 1 mile • High Probability of Exceedance, Potential for NAC, SCC, MIC • Normal Risk Areas - Other areas not designated “High Risk” • 90/800 miles (11%) designated high risk Data Integration
Intervention Criterion (Triage) • No Action - Required • Intervene - Corrective Maintenance within Year of Discovery1 or as required by regulation • Expose pipe, evaluate defect, repair if necessary • lower operating pressure • Investigate - Predictive Maintenance within 3 Years • Rank Severity based on all available data • Expose pipe, evaluate and repair in order of Severity Rank • Note1: • Discovery Means - Data is available, of sufficient reliability, for an operator to clearly determine that intervention is required. Data Integration
Intervention Criterion (Cont) Data Integration
Decision Process Data Integration
Interaction Needs with ILI Vendors • Raw data interpretation by Operator needed • Pig Performance assessment • Routine Coordination w Vendor • Comparison between Field and Pig data Data Integration
CP Mitigation Decisions • Pig Data Can Be Used for more than dig decisions • Statistically Active Corrosion - • Based on 100 foot Moving Average Pig Call Depth • Identifies “Statistically Active Corrosion” (3-10 mpy vs 0-3 mpy) • May indicate need for CP Mitigation in spite of Good CP Data • Projected Pig Features - • “Years to Dig” Projected to determine number of corrosion investigations likely in future. • Economic Model Compares Cost of Corrosion Investigations vs. Alternative Maintenance such as Additional CP or Coating Refurbishment. • Corrosion Data Overlays - GIS like display • Used to Display Relevant Corrosion Data in one source • Supports corrosion decision making and planning Data Integration
Corrosion Data Overlays Data Integration
Summary - Lessons Learned • Data Integration Depends on Decisions Required • Focus on Decision Support not just Data Management • A Management System needed - to manage changes • Decisions Based on Risk - Contain Uncertainty • Decisions depend on defect type • Corrosion, Dents, Curvature, Interaction of defects • Decisions depend on pipeline location and data limitations • High Risk v Normal Risk Locations • Intervention Criteria Based on Risk • Interaction with ILI Vendors a Must • Pig Data Can Be Used to Assess Cathodic Protection Data Integration