Download

1 / 29
300 likes | 529 Views
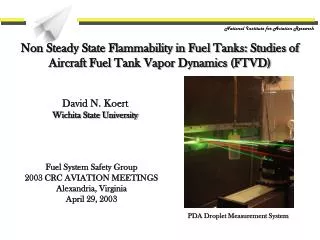
Workshop on Modeling and Measurement on Two-Phase Flows and Heat Transfer in Nuclear Fuel Assemblies, 10-11 October, 2006, KTH, Albanova University Center. Subchannel Analysis on the Steady and Transient Thermo-Hydro Dynamics in BWR Fuel Bundles with Mechanistic Methods.

E N D
Workshop on Modeling and Measurement on Two-Phase Flows and Heat Transfer in Nuclear Fuel Assemblies, 10-11 October, 2006, KTH, Albanova University Center Subchannel Analysis on the Steady and Transient Thermo-Hydro Dynamics in BWR Fuel Bundles with Mechanistic Methods Kenji YOSHIDA1, Kentaro IMURA1, Isao KATAOKA1, Noriyuki SHIRAKAWA2 and Masanori NAITO2 1: Osaka University, Japan 2: NUPEC (Nuclear Power Engineering Corporation)
Background • In order to predict the Critical Power or Void Fraction for BWR fuel bundles, and DNB heat flux for PWR, the ‘CAPE’ code with mechanistic models has been developed by NUPEC (Nuclear Power Engineering Corporation) • NUPEC has initiated a ten year project from 1993 to develop a simulation systems IMPACT (Integrated Modular Plant Analysis and Computing Technology) with financial sponsorship from the Japanese Ministry of Economy, Trade and Industry. • CAPE code has been developed as the boiling transition analysis code in INPACT project.
Background and Objectives • The objective of the CAPE code development is to perform with good accuracy the safety evaluation for a new type or improved fuel bundle design for BWR and PWR without full-scale experiments • CAPE for BWR (CAPE Mod.1.0) was validated by the test analysis for 8x8 bundles by comparing with the experimental void distribution data.
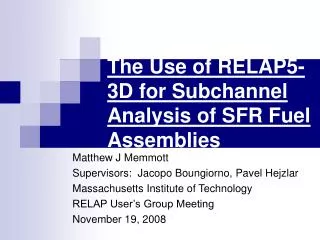
General Outline of CAPE_BWR • CAPE Mod.1.0 is the subchannel analysis code for BWR fuel assemblies based on drift-flux model with mechanistic constitutive equations. • Conservation equations: Mass, Momentum and Energy equations for each subchannnel are considered • Drift-flux model for two-phase flow modeling • Cross flow-between subchannels are considered • CAPE contains some supporting analysis modules: • Spacer effects analysis module • Dryout/DNB reference module • Boundary condition module between subchannels and spacers
2.General Outline of CAPE Code Analysis Data Experimental Data We referred to Inoue’s experiment, which was conducted in 1994 to measure the void fraction for BWR fuel assemblies. A.Inoue, et al.,”Void Fraction Distribution in BWR Fuel Assembly and Evaluation of Subchannel Code,” Journal of Nuclear Science and Technology, 32, [7], pp.629~640, (1995).
Analysis Conditions (1) Fuel assembly type : 8 x 8 Heated rods outer diameter (mm) : 12.3 Heated rods pitch (mm) : 16.2 Axial heated length (mm) : 3708 Number of water rods : 2 unheated rods outer diameter (mm) : 15.0 Channel box inner width (mm) : 132.5 Channel box corner radius (mm) : 8.0 This fuel bundle type is the typical fuel bundle type In channel flow area (mm2) : 9781 Spacer type : grid Number of spacers : 7 Spacer pressure loss coefficients : 1.2 Spacer location (mm):455,967,1479,1991,2503,3015,3527 (Distance from bottom of heated length to spacer bottom face) The computational system is the same as experimental one.
Analysis Condition Pressure (MPa) ・・・7.2 Flow Rate (t/h) ・・・55 Inlet sub-cooling (kJ/kg) ・・・50.2 Exit quality (%) ・・・2/5/12/18/25 Power(kW)・・・1237.4/1909.2/3496.0/4784.5/6453.7 Analysis Conditions (2) Assembly_1 Assembly_2
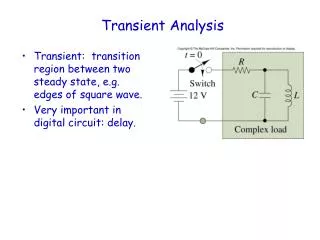
Cross-sectional Average 80 60 40 Cross-sectinal Averaged Exit Void Fraction % 20 CAPE Experiment Data 0 0 10 20 30 Cross-sectinal Averaged Exit Quality % Fig 6.1 Comparison of the exit void fraction between test and computed results. Results: The error of exit void fraction in the low quality condition (1) As exit quality becomes low, the over estimation error for void fraction at exit part tend to increase. The is the cross-sectional averaged data. To clear this tendency, the data of lower quality subchannel, which is neighboring the unheated rod or unheated wall will be plotted.
Results: The error of exit void fraction in the low quality condition (2) The average at the subchannels neighboring unheated walls The subchannel surrounded by unheated rods 80 80 70 70 60 60 50 50 Averaged exit void fraction % Exit void fraction % 40 40 30 30 We should improve the constitutive equations of the distribution parameter of bubbly flow at low quality. CAPE 20 20 CAPE Experiment Data Experiment Data 10 10 0 0 0 10 20 30 0 10 20 30 Cross-sectional averaged exir quality % Cross-sectinal Averaged Exit Quality % Fig 6.3 Comparison pf the exit void fraction of subchannel Fig. 6.2 Comparison of the exit void fraction of subchannels surround by unheated rods between test and computed results in Assembly_2 neighboring unheated walls between test and computed results.
Results: The error of exit void fraction in the low quality condition (3) Definitional equation of distribution parameter Ishii’s equation for bubbly flow is used in CAPE Distribution parameter applied to drift-flux model
Ishii’s equation for bubble flow used in CAPE Results: The error of exit void fraction in the low quality condition (4) • <The point to improve> • The second term of this equation is fixed value in most cases of vapor-water system in BWR. Therefore, this equation shows the C0 is nearly constant. • This indicates that the bubble distribution is almost fixed in subchannels. However, some researcher (eg. Kataoka) pointed out that the bubble distribution changes widely depending on the gas and liquid volumetric velocity in the vertical upward channel.
Void distribution in vertical pipe Kataoka, I., ‘Phase distribution in two-phase flow,’ Transient Phenomena in multiphase flow, Hemisphere, pp. 179-224, (1998).
Results: The error of exit void fraction in the low quality condition (5) • Another reason for the error in void fraction in low quality conditions: • Tomiyama (2002) pointed out that bubble rising velocity (drag coefficient) in subchannel is widely changed with complexity depending on the bubble diameter. • The bubble diameter should be considered in the distribution parameter C0 or the drift-velocity. Tomiyama, A. et al, ‘Rising velocities and shapes of single bubble in a subchannel,’ Proc. of JSME Annual Meeting 2002, pp.211-212, (2002).
Transient Analysis -Turbine Trip- • CAPE-T code, which is the modified CAPE for BWR for transient analysis • The prediction for the Turbine Trip (TT) were carried out. • The validation of CAPE-T is carried out by comparing with the benchmark data of the macroscopic grade void distribution (BFBT-3 benchmark, Phase1 Exercise3)
: 1.30 : 1.15 : 0.89 : 0.45 I=1 2 3 4 5 6 7 8 9 J= 1 2 3 4 5 6 7 8 9 Conditions for assembly • Assembly type is Type 4, in which a large unheated rod exist in the center of the assembly • The power distribution is uniform in axial direction
Boundary conditions (1) • Measured data: • space averaged instantaneous axial void profiles during the condition of Turbine Trip without Bypass • Boundary conditions: • Pressure, Inlet flow rate, Inlet subcooling and Power distribution
Boundary conditions for TT • In Turbine Trip without bypass, • The TT occurs 10 second after starting • The total power output rises sharply up to about 1.5 times of the normal operation, and goes down to the half rapidly in 2~3 seconds, after 45 second, rises up gradually to the normal value • The flow rate decreases synchronously with changing the power. After 42 second, rises up gradually to the normal. • The pressure goes up rapidly with the power change. After that, decreases gradually to the normal value. Power and Flow rate Pressure
Results: Turbine TripTransients of cross-sectional average void fraction • The computational results have reasonable agreements qualitatively with the experimental results. • The absolute changes of void in calculation are smaller than that of exp. The cause seems complex; missing the axial heat conduction in bundles, DNB correlations, etc.
Conclusions • The errors in the computed void fraction are increase as the quality decreases. In particular, the errors in the subchannels neighboring the unheated rod becomes outstanding. • The constitutive equations for the distribution parameter should be improved. • The local void distribution (core peek, wall peek, etc.) • The bubble diameter should be considered in the correlations. • In the transient analysis for Turbine Trip, the computational results had a reasonable qualitative agreement with the experimental results. • But, the absolute changes of void in calculation are smaller than that of experiments. The cause seems complex; missing the axial heat conduction in bundles, DNB correlations, etc.
Background (2) We need the new fuel bundle to improve the efficiency of the nuclear power plant. It is difficult to examine with mock-up scale method for each experiment because of the costs and time. We want to decrease the dependence of mock-up scale experiments We need improve the reliability of analysis code to replace experiments.
6.Next Schedule ・足立らはFEP管を用いてサブチャンネル内の気泡の様子を可視化し、サブチャンネル内の気泡形状を研究(混相流学会2002) 水谷らはFEPにより4x4バンドルの模擬実験装置を用いて流動様式に関して研究 Ishiiの式に代わる分布定数に関する式の作成
General Outline of CAPE Code • CAPE is the subchannel analysis code developed by NUPEC in the IMPACT project. • By using CAPE code, Each subchannel data is obtained. • CAPE’s functions are the calculation of heat transfer around the fuel rods, two-phase flow analysis, and so on • In CAPE code, the following models are used. • Drift flux model • Lahey’s model (void drift model) and so on • The output data are “pressure drop,liquid film thickness,void fraction distribution,and so on ”
C0=1.2 Saddle form
Ishii’s equation for bubble flow used in CAPE Results: The error of exit void fraction in the low quality condition (5) Another reason for overestimations for void fraction: According to Tomiyama’s researches, drag coefficient changes for bubble diameter. So we consider influence of bubble diameter upon Ishii’s equation.
Conclusion [1]The errors in the computed void fraction expand as the exit quality is decreased. In particular, the error in the subchannels with unheated rod becomes outstanding. [2]The constitutive equations for distribution parameter should be improved to accurately represent the cross-sectional void distribution in the subchannels including the unheated rod. [3]Relative velocity of bubble and its diameter should be more reasonably considered in the constitutive equations.
Contents 1.Background 2.General Outline of CAPE Code 3.Analysis Condition 4.Results 5.Conclusion