Download
1 / 25
260 likes | 379 Views
S&P 500 - Financial Sector (S5FINL). Stock Market FIN 824 Rebecca Dunn Christina Durrough Nicholas Ferrugia May 12, 2009. Business Cycle. Financial Sector is cyclical Mature phase of life cycle High barriers to entry High level of competition. S&P 500 Weighting. S&P 500 – 10 Sectors

E N D
S&P 500 - Financial Sector (S5FINL) • Stock Market FIN 824 • Rebecca Dunn • Christina Durrough • Nicholas Ferrugia • May 12, 2009
Business Cycle • Financial Sector is cyclical • Mature phase of life cycle • High barriers to entry • High level of competition
S&P 500 Weighting • S&P 500 – 10 Sectors • Largest Sector: Information Tech -18.8% • Smallest Sector: Materials – 3.2% • Financial Sector: 11.6% Market Cap • Current • Historical • Source: http://www.soundmoneytips.com/
Financial Sector Weighting • Current Financial sector weight is below average • Weight is trending up • Weight increased during the housing boom Top Ten Stocks http://www.bloomberg.com/apps/cbuilder?ticker1=S5FINL%3AIND
Performance Analysis • Frequency • The percentage of months the returns of Financial sector outperformed the returns of S&P 500 • At least 2 out 3 times (67%) to statistically favor future out performance • Frequency data suggests the S&P 500 has a positive probability of outperforming the returns of the Financial sector in the future • Compounded Rate of Return • The monthly compounded return of $1 invested in S&P 500 and Financial sector over the last 25 years • S&P 500 consistently outperforms the financial sector • Data as of 4/30/2009
Sector Performance • Financial Sector has seen the greatest negative returns YTD • Financial Sector has seen the most positive returns QTD • Data as of 4/30/2009
Industry Performance • Data as of 5/1/2009
Technical Analysis • Financial Sector • Channel is indicating continuous decline • Upper and Lower bound of channel each have > 3 solid contact points • Upward movement on 4/29 reached upper bound, but did not break bound and receded • Increasing Forward P/E ratio suggest near term breakout
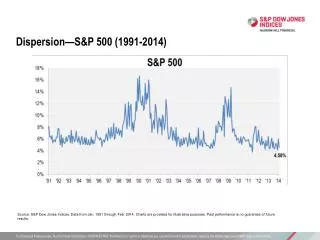
Breadth S&P 500 indicating positive near term growth • S&P 500 • S&P 500 is currently trading 3.73% above its 50-day moving average • Average stock in the index is 5.34% above its 50-day moving average • Sectors • Energy sector stocks are starting rally • +4.58 between the average stock's distance from its 50-day versus the sector's distance from its 50-day • Financial sector is trading 10.12% above its 50-DMA, but lead by a few key stocks • -4.58 between the average stock's distance from its 50-day versus the sector's distance from its 50-day • Only two sectors remain below their 50-days • Health Care and Utilities (Defensive in Nature) • Source: http://seekingalpha.com/
SIM Market Capitalization • Financial Sector Market Capitalization • Market Cap. $1.2 mil • SIM is underweight (3.15%) relative to the S&P 500 • SIM: 8.45% • S&P: 11.60%
SIM Market Capitalization • Financial Sector Market Capitalization • SIM is underweight (3.15%) relative to the S&P 500 • SIM: 8.45% • S&P: 11.6%
SIM – Financial Sector • SIM Portfolio • Current Composition • Berkshire Hathaway: 46.38% • Hudson City Bancorp:28.61% • Wells Fargo: 25.01% • Hudson City Bancorp has had the best performance - up 8% since purchase
Ratio Valuation Financial sector is inline with expectation • Forward P/E • Current Forward P/E ratio of 17.2 is considered to be in the fair value range • Forward P/E ratio is only 1.1x relative to the S&P 500 • P/CF • Current P/CF ratio is 2.5 relative to the S&P 500 • Implies the market expects the company to be financially stable in the future Forward P/E P/CF
Ratio Valuation • P/B • Sector is inline although P/B is increasing and ROE is decreasing • Recent increase in P/B has been attributed to new mark-to-market accounting rules in Q1 09 that positively effect ration • P/B is still considered low at .08 • Key indicator when Financial sector is undervalued - BUY • ROE trending up and P/B has not adjusted for increase P/B ROE
Profit Margin • Financial sector credit loss provision have eroded profit margin • Lowest profit margin since 1990 compared S&P 500 • Main contributor to low profit margin are losses related to toxic assets and credit defaults • Profit Margin is a lagging indicator, but based on the markets expectations of sector should rebound in mid 2009
Ratio Valuation • Forward P/E • High: Div Fin’l SVC (35.50) • Low: INS Multi-Line (5.30) • Avg. P/CF 5 Year • High: Mult-Sec Hldgs (80.70) • Low: Ind. REITs (2.90)
Financial Sector Valuation • Forward P/E ratios vary amongst industries and companies • Insurance and REIT industries have lower forward P/E ratios • P/CF ratios vary greatly • REITs and thrifts and mortgages have higher P/CFs • Ratios have contracted over recent years due to the collapse of the market, largely due to mortgage crisis • Expect the sector to expand in coming years based on the forward valuations
Economic factors – past 5 years • As oil prices increase, home prices and financial returns decrease
Fama and French Style Factors • Factors • HML (Value – Growth) • SMB (Small Cap. - Large Cap.) • UMD (Momentum) • Regression Analysis • S&P 500 • HML and UMD monthly change are both “statistically significant” and negatively correlated to the S&P 500 monthly returns • These Style factors explain 15% of the variance in the S&P 500 monthly returns • Momentum (+) showed to be “statistically significant” relationships to predict future return • Financial Sector • Momentum (+) showed to be “statistically significant” to predict future return • Regression: Dependent S&P 500 monthly return change, Independent Style factors month return change
MACRO Factors • Factor • Reviewed 15 Macro Factors • Regression Analysis • S&P 500 – Month • These Macro factors explain 25% of the variance in the monthly returns of the S&P 500 (statistically significant) • Consumer Confidence (+) • CPI (+) • Aaa Corporate Rate Spread (-) • Consumer Credit Outstanding (+) • S&P 500 – Forecast • These Macro factors explain 09% of the variance in the monthly returns of the S&P 500 that occurs in 3 months (statistically significant) • Rf (+) • Unemployment (-)
MACRO Factors • Regression Analysis • Financial Sector – Month • These Macro factors explain 27% of the variance in the monthly return of the Financial Sector (statistically significant) • RF (+) • Consumer Confidence (+) • Consumer Credit Outstanding (+) • Financial Sector – Forecast • Next Month Return: Rf (-), CPI (+) and Unemployment (-) are statistically significant Macro factors that explain 11% of the variance • These Macro factors explain 34% of the variance in the monthly return of the S&P 500 that occur in 3 months (statistically significant) • Rf (+) • Unemployment (-) • CPI (-) • Aaa Corporate Rate Spread (-) • Consumer Credit Outstanding (+)
Summary • Current portfolio is underweight relative to the S&P • S&P weight is currently below historical levels • Weight will increase as the market increases • Based on the data, the SIM portfolio is in a good position • P/B ratio and ROE show that the sector is undervalued • Valuation ratios reflect the expectation of positive returns for financial sector • There is currently much momentum in the market relative to the financial sector
Recommendation • Expect positive returns relative to the market • Expect housing starts and investments in major assets to be a positive for the sector as the recession comes to an end • Overweight diversified industries • Expect hedge funds to continue to struggle • Underweight REITs and Specialized Industries • Recommendation: Continue to underweight relative to the market • Begin to increase as the market rebounds • Continue to underweight by 315 bp