Download
1 / 16
180 likes | 292 Views
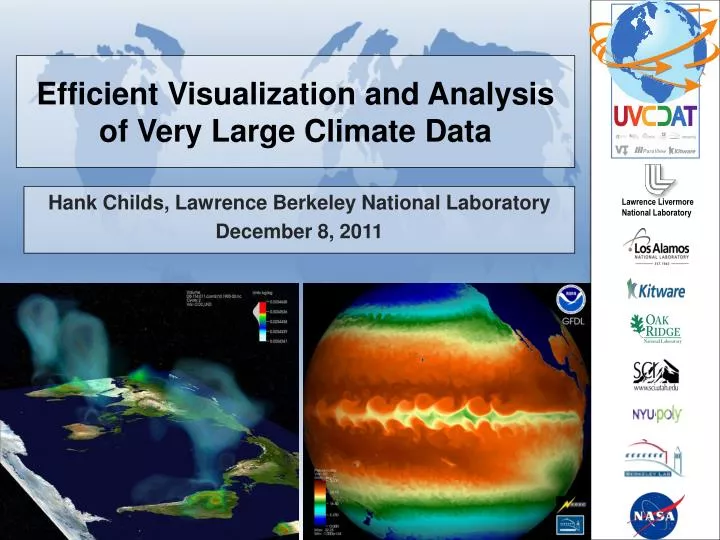
Efficient Visualization and Analysis of Very Large Climate Data. Lawrence Livermore National Laboratory. Hank Childs, Lawrence Berkeley National Laboratory December 8, 2011. Problem Statement. Climate data is getting increasingly large (massively data!), both spatially and temporally

E N D
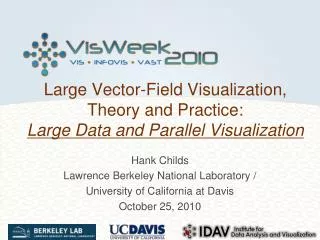
Efficient Visualization and Analysis of Very Large Climate Data Lawrence Livermore National Laboratory Hank Childs, Lawrence Berkeley National Laboratory December 8, 2011
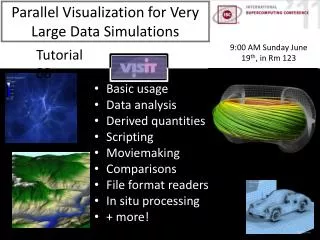
Problem Statement • Climate data is getting increasingly large (massively data!), both spatially and temporally • Climate scientists want to process this data in lots of ways: • Analyze simulation recently run on their supercomputer • Download remote data to nearby supercomputer for analysis • Download remote data to desktop computer for analysis • Send analysis routines to remote machine location, results are returned.
VisIt is an open source, richly featured, turn-key application for large data. 1 billion grid points / time slice 217 pin reactor cooling simulation Run on ¼ of Argonne BG/P Image credit: Paul Fischer, ANL • Used by: • Visualization experts • Simulation code developers • Simulation code consumers • Popular • R&D 100 award in 2005 • Used on many of the Top500 • >>>100K downloads • Developed by: • NNSA, SciDAC, NEAMS, NSF, and more
localhost – Linux, Windows, Mac Graphics Hardware VisIt employs a parallelized client-server architecture. remote machine User data Parallel vis resources • Client-server observations: • Good for remote visualization • Leverages available resources • Scales well • No need to move data
1T 16K, 32K Dawn Franklin Cray XT4 #cores Problem Size Model Machine 8K 0.5T IBM P5 16K 1T Purple Ranger BG/P 4T 64K JaguarPF Sun 2T Cray XT5 Juno X86_64 1T, 2T 16K 32K VisItrecently demonstrated good performance at unprecedented scale. VisIt’s data processing techniques are more than scalability at massive concurrency; we are leveraging a suite of techniques developed over the last decade by VACET, the NNSA, and more. Two trillion cell data set, rendered in VisIt by David Pugmire on ORNL Jaguar machine • Weak scaling study: ~62.5M cells/core 5
VisIt is used to look at simulated and experimental data from many areas. Fusion, Sanderson, UUtah Astrophysics, Childs Nuclear Reactors, Childs Particle accelerators, Ruebel, LBNL
Problem Statement • Climate data is getting increasingly massive, both spatially and temporally • Climate scientists want to process this data in lots of ways: • Analyze simulation recently run on their supercomputer • Download remote data to nearby supercomputer for analysis • Download remote data to desktop computer for analysis • Send analysis routines to remote machine location, results are returned. Mission accomplished?
General-purpose tools vs application-specific tools Application-specific tools: General-purpose tools: • Are developed by large teams, leading to: • Robustness • Efficient algorithms • Rich set of features • Are made specifically to solve your problem: • Streamlined user interface • Application-specific analysis • But, they have smaller user and developer communities, so they are: • Less robust • Less efficient algorithms • Smaller set of features • But: • They aren’t streamlined for a given application area (lots of button clicks) • They don’t have application-specific methods So which do users want?
Amazing developments over the last decade… • Very useful packages now available that make quick tool development possible: • Python, R, VTK, Qt • But this doesn’t solve the large data issue. • … but tools now are available that do that as well: • VisIt & ParaView • Great idea: put all these products together into one tool (VisTrails). • Users get: • The robustness, richness, and efficiency of large development efforts • Streamlined user interface & climate-specific analysis (via CDAT) This tool is UV-CDAT.
UV-CDAT • UV-CDAT = Ultra-scale Visualization Climate Data Analysis Tools (UV-CDAT) • Goal: robust tool, capable of doing powerful analysis on large climate data sets. • Collaboration between two DOE BER teams • One tool that incorporates many packages… • … including “VisIt” UV-CDAT Developers: Dean Williams (PI) Jim Ahrens, Andy Bauer, Dave Bader, Berk Geveci, Timo Bremer, Claudio Silva, David Partyka, Charles Doutriaux, Robert Drach, Emanuele Marques, Feiyi Wang, Jerry Potter, Galen Shipman, John Patchett, Phil Jones, Thomas Maxwell, and many more
P2 P4 P1 P3 P0 P5 P8 P7 P6 P9 Big data visualization tools use “pure parallelism” to process data. Parallelized visualization data flow network Parallel Simulation Code Read Process Render Processor 0 This is a good approach for high resolution meshes … but climate data is often different Read Process Render P0 P1 P2 P3 Processor 1 P4 P5 P6 P7 Read Process Render Pieces of data (on disk) P8 P9 Processor 2
Parallelizing Processing Over Time Slices: Improving Performance For Climate Data T=2 T=1 T=0 Objective T=5 T=4 T=3 VisIt’s parallel processing techniques were designed for single time slices of very high resolution meshes. We must adapt this approach for the lower resolution and high temporal frequency characteristic of climate data. T=8 T=7 T=6 P0 P1 P2 P0 P1 P2 VisIt parallelizing over a high resolution spatial mesh VisIt parallelizing temporally over a low resolution mesh This is just one aspect of the uniqueness of climate data … many more. Progress & Results Impact • We have modified VisIt’s underlying infrastructure to have a “parallelize over time” processing mode. • We implemented a simple algorithm (“maximum value over time”) as a proof of concept Climate scientists with access to parallel resources for their data will be able to process their data significantly faster through parallelization. This software investment will enable other algorithms developed by the project to also be accelerated through parallelization. Scaling on 2130 time slices of NetCDF climate data (source: Wehner)
Success story: spatial extreme value analysis • We were able to parallelize the spatial extreme value analysis: • Parallelization was both spatial and temporal • Parallelization was done with VisIt infrastructure, but analysis was done with R (via VisIt-R linkage) • Ran on CCSM3.0, 100 year, daily precipitation data • Near perfect scaling on 36,500 time slices
Summary • Visualization and analysis of massive data is possible • Other communities have built tools for this purpose • These tools are effective for: • Local or remote data • Modest to massive parallelization (& serial too!) • Interactive or batch processing • Our effort focuses on deploying VisIt and R as part of UV-CDAT. • VisIt is excellent with large data and has been adapted to work with climate data. • We also are collaborating on cutting edge analysis techniques with climate scientists