Download
1 / 29
290 likes | 570 Views
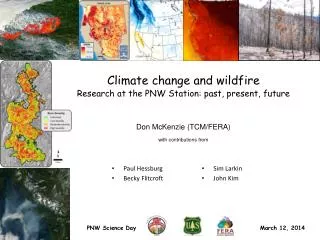
Climate Change: Past, Present, and Future Dr. Cameron Wake Climate Change Research Center Institute for the Study of Earth, Oceans, and Space (EOS) University of New Hampshire 2006 Boston World Oil Conference 26 Oct 2006. http://cdiac.esd.ornl.gov/. Atmospheric Carbon Dioxide.

E N D
Climate Change: Past, Present, and Future Dr. Cameron Wake Climate Change Research Center Institute for the Study of Earth, Oceans, and Space (EOS) University of New Hampshire 2006 Boston World Oil Conference 26 Oct 2006
Atmospheric Carbon Dioxide Petit et al., 1999
Atmospheric Carbon Dioxide http://cdiac.esd.ornl.gov/
Atmospheric Carbon Dioxide IPCC 2001
Atmospheric Carbon Dioxide Projected (2100) IPCC 2001 - B1 IPCC 2001
Global Temperature 1880-2005 (meteorological stations) http://www.giss.nasa.gov
Average Annual Temperature in NE US & CDN Maritimes 1900-2002 1.4 oF warming over 103 years 1.8 oF warming over 33 years Time-series represents an aerially weighted average of data from 136 stations. Data from the NOAA-NCDC and Environment Canada
Spatial Variation of Annual Temperature Trend 1970-2002 The temperature trend was calculated from a linear regression of annual average temperature for each station.
Average Winter Temperature in the NE US & CDN Maritimes 1900-2002 2.3 oF warming over 103 years 4.3 oF warming over 33 years Time-series represents an aerially weighted average of data from 136 stations. Data from the NOAA-NCDC and Environment Canada
Spatial Variation of Extreme Precipitation Trend 1970-2002 The extreme precipitation trend was calculated from a linear regression of number of events each year for each station.
Spatial Variation of Days with Snow on Ground 1970-2002 The snow on ground trend was calculated from a linear regression of annual total snow on ground days for each station.
Northeast Climate Impacts Assessment (NECIA) • Collaboration between UCS and 40 independent scientists • Analytic Approach Assess projected changes in climate and potential impacts through 2100 under lower and higher scenarios of heat-trapping emissions. • Geographic Scope Nine Northeast states, from Maine to Pennsylvania. • Peer Review K. Hayhoe, C. Wake, et al., Climate Dynamics, in press BAMS, in review
Northeast Observed and Modeled Snow on Ground Days per Month
Northeast Modeled Snow on Ground Days Higher emissions: 50% reduction in snow-covered days (shown here) Lower emissions: 25% reduction in snow-covered days
Sea Level Rise Higher: 8-33 inches Lower: 4-21 inches These estimates do not include the potential for additional increases due to more rapid melting of major polar ice sheets.
Conclusions • Climate is already changing across the Northeast • Over the next few decades, similar changes expected under both emissions scenarios • By mid-century, most changes are greater under the higher scenario • By late-century, under the higher-emissions scenario: • Many changes are almost twice those seen under lower emissions, including: • winters warming by 8 -12F and summers by 6 -14F, with dramatic increases in extreme heat in cities.
Time For Action • Individuals • Institutions • Citizens
Observed vs. Modeled Global Temperatures 1850-2000 (solar variations and volcanic activity) From IPCC Climate Change 2001: The Scientific Basis (http://www.ipcc.ch)
Observed vs. Modeled Global Temperatures 1850-2000 (Greenhouse gases and sulfate aerosols) From IPCC Climate Change 2001: The Scientific Basis (http://www.ipcc.ch)
Observed vs. Modeled Global Temperatures 1850-2000 From IPCC Climate Change 2001: The Scientific Basis (http://www.ipcc.ch)
What path will we take to the future? Two roads diverged in a wood, and I - I took the one less traveled by, And that has made all the difference. Robert Frost