Download
1 / 93
1.03k likes | 1.28k Views
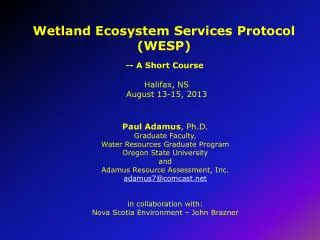
Wetland Ecosystem Services Protocol. -- A Short Course Mission, Oregon August 11-13, 2014. Paul Adamus , Ph.D. Graduate Faculty, Water Resources Graduate Program Oregon State University and Adamus Resource Assessment, Inc. adamus7@comcast.net in collaboration with :

E N D
Wetland Ecosystem Services Protocol -- A Short Course Mission, Oregon August 11-13, 2014 Paul Adamus, Ph.D. Graduate Faculty, Water Resources Graduate Program Oregon State University and Adamus Resource Assessment, Inc. adamus7@comcast.net in collaboration with: Confederated Tribes of the Umatilla Indian Reservation – Scott O’Daniel US Environmental Protection Agency – Tracie Nadeau
WET WESP regionalizations United States Oregon Alaska south Alberta (3 regions) 1983, 1987 2009-present 2011-present 2012-present
Tuesday 8:30 Introductions. Course logistics. Brief history of wetland functions assessment Definitions: wetland functions, values, and “health” (condition) How WESP works 10:30 BREAK Delimiting the assessment unit Interpreting the field data form questions 12:00LUNCH on your own 1:15 Fill out Office Form (OF) for first wetland 2:00 Visit first wetland and apply WESP 4:30 end Wednesday 8:30 Review scores from first wetland Lecture: Principles of Hydrologic Functioning & Value Lecture: Principles of Water Quality Functioning & Value 10:30 BREAK Lecture: Habitat Support – Models for Functions & Values 12:00LUNCH on your own 1:15 Fill out Office Form (OF) for second wetland 2:00 Visit second wetland and apply WESP Discuss results and potential applications 4:30 end
Popular Myths About Wetland Functions and Assessment 1. If a watershed has lots of erosion, its wetlands must be performing the Sediment Retention function. 2. Vegetation is the most important predictor of a wetland’s water quality function. 3. Organic soils hold nutrients more effectively than mineral soils. 4. Wetlands that are the least-altered by humans are almost always high-functioning. 5. Water quality function is associated more with wetlands on the edges of streams and lakes than isolated wetlands. 6. To properly assess a wetland’s functions, you must first classify it. 7. Results from assessment methods with simple scoring formulas and one-page data forms are nearly as accurate & repeatable as from more detailed methods. 8. A few on-site measurements of environmental variables tell you more about a wetland’s functions than twice as many on-site visually-estimated variables, plus variables measured in the office with GoogleEarth and/or GIS, plus local knowledge.
Quick Review of Definitions Wetland Determination Wetland Delineation Wetland Classification Wetland Categorization Wetland Assessment
Wetlands aren’t always wet! • Surface Water + Vegetation YES • If No Surface Water, then: • soil indicators + plant indicators • (cannot determine only from aerials) Which of these are wetlands ?
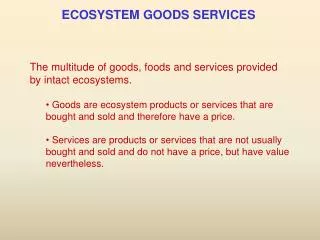
How To Tell? CONSIDER: • Functions: what a wetland does naturally • Values (Benefits): • Values of Functions (e.g., water storage flood protection) • Opportunity to perform function (upslope) • Significance of function when performed (downslope) • Integrity (a.k.a. Ecological Condition, Health, Quality, Naturalness) • Uniqueness/ Relative Abundance • Recreation, Education, Aesthetics • Production of Sustainable Commodities (timber, hay, fish, etc.) • Ecosystem Services = Functions + their Values • Risk to Wetland: • Stressors (Threats) • Sensitivity = Resistance & Resilience to stressors
Condition Assessment Methods Function Assessment Methods Ecosystem Services Assessment Methods
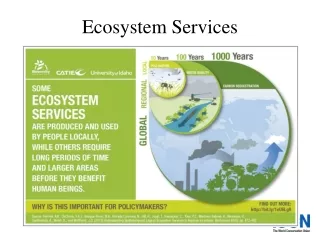
WESP: A spreadsheet with a suite of models for assessing 14 wetland ecosystem services at a site scale.
Uses of WESP Outputs • PRIMARY: • Use scores as a partial basis for deciding: • avoid or mitigate? • which mitigation ratio to use? • are we truly replacing functions in kind? • Identify ways to minimize impacts to functions of a wetland. • Identify wetland designs that may provide greatest levels of particular ecosystem services. • SUPPORTING: • Prioritize all wetlands in a rapidly developing watershed or region. • Monitor success of individual restoration projects.
Steps for Using WESP 1. Go online and download current version of: Excel spreadsheet PDF files for data forms OF, FieldF, and FieldS Print the PDF files, not Excel spreadsheet. 2. Read and thoroughly understand Manual (and Short Guide). 3. Fill out Office Form (OF) (~1 hour) 4. Visit wetland. Decide on AA boundary. Fill out 2 data forms -- FieldF and FieldS. Texture the soils. Look for water lines, weeds, veg patterns, etc. Landowner interview if possible. 5. Enter data in Excel spreadsheet. 6. Interpret results.
WESP Basic Features Intended to avoid simplistic assumptions, e.g., marshes better than forested wetlands. Provides 0-10 score for 16 wetland functions and their values. Scores from different users are very consistent (+/- 0.5 on 0-10 scale). Oregon version required by State of Oregon. Long history. Uses ~120 indicators, but many “skip to’s.” Takes less than 2 hours per site. Quick to learn. No specialized expertise required. Tidal & Non-tidal Wetlands. Office & Field components. Strongly rooted in scientific literature. Peer reviewed. Can be applied at multiple scales: Entire wetland: prioritize for purchase or enhanced regulatory protection. Part of a wetland: road widening, residential development.
Why standardize functional assessment? • Few people can predict all wetland functions. • Few can instantly recall all indicators of functions. • Different people mentally assign different weights to indicators. • Reduces arbitrariness increased public confidence. • “Paper trail” -- legal reasons. • The Trade-off: less flexibility to accommodate quirks of a particular site
Challenge faced by all “one-visit” assessment methods: Wetland Conditions can be Dynamic Tidal Dynamics
Ways to Assess Functions & Values Example: Indicators of Nitrogen Removal
Option 1: Simple list of indicators • Duration and pattern of soil saturation • Soil organic content • Soil temperature
Option 3: Pre-specify the: • condition weights for each indicator, and • the rules (models) for combining indicators
Types of WESP Indicator Questions True-False: Choose the most applicable: Choose all applicable:
Operating Principles for Delimiting Wetland Assessment Areas (AA’s) • Does adjoining open water cover <20 acres? Include it! • Otherwise, break into separate AA’s and include the open water only if question asks. • Delimit separate AAs if hydroperiod (surface water duration, extent) differs greatly on opposing sides of a road or berm. • Delimit separate AAs if wetland is bisected by a watershed divide (opposing flow directions within the wetland). • Delimit separate AA for each wetland class (the WESPAK-SE ones) within a wetland, • BUT ONLY IF: • They comprise >20% of the wetland’s total vegetated area • The AA would otherwise be impossible to assess (many miles across) • Delimit as a separate AA the 100-ft buffer adjoining both sides of an anadromous stream. • With rare exceptions, avoid dividing a wetland based ONLY on: • Property lines • Fences • Zoning designations • Vegetation or Cowardin (NWI mapped polygon) types
Saturated vs. Seasonally Flooded Only vs. Persistently Flooded
Indicators of HIGH water(= upper limit of Seasonally Inundated zone) Water marks on trees (moss); water-stained leaves; algae amid grass stems Drift lines of debris on ground or suspended in shrubs Scoured areas on the soil surface Fresh deposits of water-borne sediment Height of culvert or berm relative to current water level Aquatic plants without water beneath Airphoto sequence Indicators of where LOW water persists (= lower limit of Seasonally Inundated zone) (= upper limit of Persistently Inundated zone) Minimal vegetation (all Obligates). No woody. Topography Airphoto sequence
Key Terms As Defined by WESP Surface Water Groundwater Bordering Waters Open Water Ponded Water Upland Perennial Cover Herbaceous (Herbs) Forbs Emergents Sedges distance “uphill from” “predominant” vs. “most”
Wildlife Access Draw a circle of radius of 0.5 mile from the center of the AA. If mammals and amphibians can move from the center of the AA to all other separate wetlands located within the circle without being forced to cross maintained roads (any width), lawns, bare ground, marine waters, and/or steep (>30%) slopes, mark 1= yes can move, or no other wetlands within that distance, or 0= no.
Score = 6.6 Anadromous Fish Habitat Score = 0 Paul Adamus March 2010
Score = 8.4 Waterbird Feeding Habitat Score = 2.3 Paul Adamus March 2010
Score = 9.4 Amphibian & Turtle Habitat Score = 1.9 Paul Adamus March 2010
Score = 7.9 Native Plant Diversity Score = 2.1 Paul Adamus March 2010
Thermoregulation Score = 5.5 Score = 0 Paul Adamus March 2010
Score = 10.00 Nitrate Removal Score = 3.2 Paul Adamus March 2010