Download
1 / 24
280 likes | 534 Views
Ecological modelling. Our program. Matrix algebra I Matrix algebra II General additive models Jackknifing and bootstrapping Population models Richness patterns in communities Nestedness analysis Indicator species analysis. Additional sources.

E N D
Our program Matrix algebra I Matrix algebra II General additivemodels Jackknifing and bootstrapping Populationmodels Richnesspatternsincommunities Nestedness analysis Indicatorspeciesanalysis
Additionalsources http://en.wikipedia.org/wiki/Matrix_(mathematics) K. Kaw. 2002. Introduction to matrix algebra http://www.autarkaw.com/books/matrixalgebra/index.html http://www.ems.bbk.ac.uk/faculty/phdStudents/efthyvoulou/Kaw.pdf Introduction to matrix algebra and linearmodels: http://nitro.biosci.arizona.edu/courses/EEB581-2006/handouts/LinearI.pdf http://matwww.ee.tut.fi/Kost/MatrixAlgebra-toc.html Matrix cook book http://www2.imm.dtu.dk/pubdb/views/edoc_download.php/3274/pdf/imm3274.pdf Matrix http://en.wikipedia.org/wiki/Matrix_theory A first courseinlinear algebra (freeonlinetextbook) http://linear.ups.edu/download.html Matrix algebra and regression http://www.stat.tugraz.at/courses/files/s05.pdf
A vectorcan be interpreted as a file of data A matrixis a collection of vectors and can be interpreted as a data base The red matrixcontainthreecolumnvectors Handlingbiological data is most easilydonewith a matrixapproach. An Excel worksheetis a matrix.
A general structure of databases The first subscriptdenotesrows, thesecondcolumns. n and m definethedimension of a matrix. Ahas m rows and n columns. Rowvector Columnvector Twomatricesareequaliftheyhavethe same dimension and allcorrespondingvaluesareidentical.
Solvingsystems of linearequations The Nine Chapters on the Mathematical Art.(1000BC-100AD). Systems of linearequations, Gaussianelimination Gottfried Wilhelm Leibniz(1646-1716)Determinants to solvelinearequations TakakazuShinsuke Seki(1642-1708)Determinants to solvelinearequations Matrixapproaches Arthur Cayley(1821-1895)Formalmatrix algebra Olga Taussky-Todd(1906-1995)Finitevaluematrices Johann Carl Friedrich Gauss (1777 – 1855)Gaussianelimination, inverse
Someelementarytypes of matrices In biology and statisticsaresquarematricesAn,n of particularimportance Lower and uppertriangularmatrices Thesymmetricmatrixis a matrixwhereAn,m = A m,n. Thediagonal matrixis a square and symmetrical. Unit matrixI is a matrixwith one row and one column. Itis a scalar (ordinarynumber).
Matrix operations Addition and Subtraction Addition and subtractionareonlydefined for matriceswithidenticaldimensions S-product
Theinnerordotorscalarproduct Assume you have production data (in tons) of winter wheat (15 t), summer wheat (20 t), and barley (30 t). In the next year weather condition reduced the winter wheat production by 20%, the summer wheat production by 10% and the barley production by 30%. How many tons do you get the next year? (15*0.8 + 20* 0.9 + 30 * 0.7) t = 51 t. Thedotproductisonlydefined for matrices, wherethenumber of columnsinthe first matrixequalsthenumber of rowsinthesecondmatrix.
We add another year and ask how many cereals we get if the second year is good and gives 10 % more of winter wheat, 20 % more of summer wheat and 25 % more of barley. For both years we start counting with the original data and get a vector with one row that is the result of a two step process
Thenumber of columnsinthe first matrixmustequalthenumber of rowsinthesecondmatrix.
Matrixaddin for Excel: www.digilander.libero.it/foxes/SoftwareDownload.htm
Someproperties of thetranspose onlyifAissquare and symmetric alwaysexists and gives a symmetricmatrix IfAisorthogonalA’Ais diagonal, but AA’ need not to be diagonal
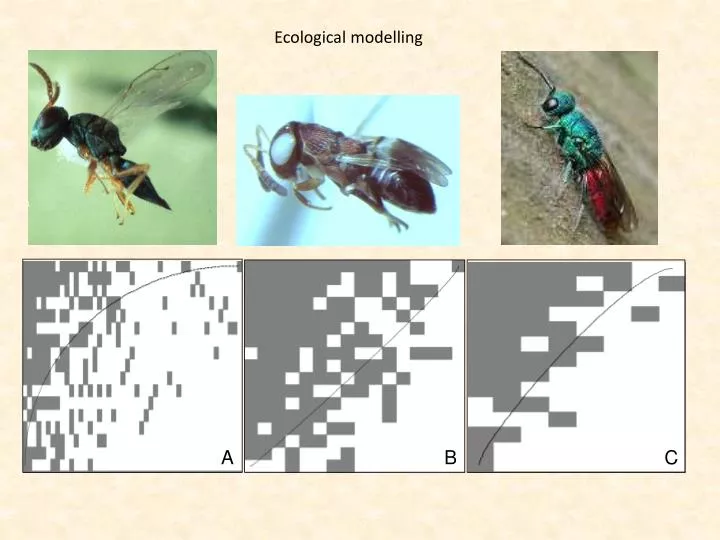
Groundbeetles on Mazurianlakeislands (Mamry) Carabusproblematicus Carabusauratus Photo Marek Ostrowski
Theentries of thematrixgivethe sum of probabilitiesthattwospeciesmeet on any of theislands.
Assume you are studying a contagious disease. You identified as small group of 4 persons infected by the disease. These 4 persons contacted in a given time withanother group of 5 persons. The latter 5 persons had contact with other persons, say with 6, and so on. How oftendid a person of group C indirectlycontactwith a person of group A? B 1 2 3 4 5 C 1 2 3 4 5 6 A 1 2 3 4 B 1 2 3 4 5 We eliminate group B and leavethe first and last group. No. 1 of group C indirectlycontactedwithallmembers of group A. No. 2 of group A indirectlycontactedwithallsixpersons of group C. C 1 2 3 4 5 6 A 1 2 3 4
Instead of contact we useprobabilities of beinginfected. Person 1 of group C hasthehighestprobability of beinginfected.