Download
1 / 38
380 likes | 418 Views
MINERAL WEATHERING PROCESSES-I. Chapter 7. LEARNING OBJECTIVES. Be introduced to the factors influencing the resistance of primary minerals to weathering. Become familiar with the nature of the products of weathering (clays, oxides and hydroxides).

E N D
MINERAL WEATHERING PROCESSES-I Chapter 7
LEARNING OBJECTIVES • Be introduced to the factors influencing the resistance of primary minerals to weathering. • Become familiar with the nature of the products of weathering (clays, oxides and hydroxides). • Understand the principles governing the solubility of quartz. • Understand the principles governing the solubility of Al- and Fe-oxyhydroxides.
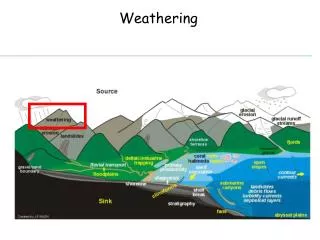
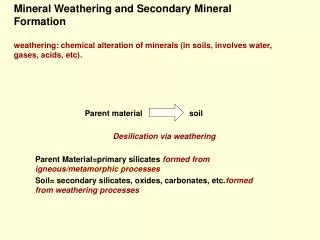
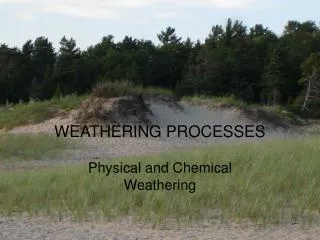
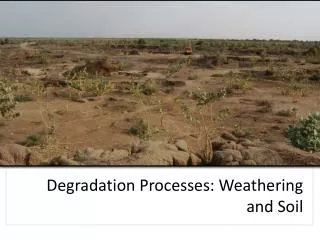
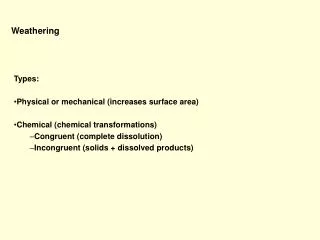
WHAT IS WEATHERING? • Weathering refers to the low-temperature reactions between water (containing O2 and CO2) and minerals in soils and rocks. • Weathering is the readjustment of unstable, high-pressure and -temperature minerals to oxidizing, acidic, low-temperature conditions. • There are three main weathering processes: • Congruent dissolution • Incongruent dissolution • Oxidation
GOLDICH’S STABILITY SERIES Weathering rates follow a series roughly the inverse of the order of original crystallization for igneous minerals (Bowen’s Reaction Series).
WHY GOLDICH’S SERIES? • Goldich’s series is in part a reflection of the crystal structures of the silicates and the molar ratio of silica to oxygen. • The higher the Si:O ratio, the more covalent the structure and the fewer other metal cations required for charge balance. • Quartz, the most resistant to weathering, has an Si:O ratio of 0.5, and olivine, the least resistant to weathering, has an Si:O ratio of 0.25.
EVALUATION OF THE SATURATION STATE OF A SILICATE MINERAL To determine whether or not a water is saturated with an aluminosilicate such as K-feldspar, we could write a dissolution reaction such as: KAlSi3O8 + 4H+ + 4H2O K+ + Al3+ + 3H4SiO40 We could then determine the equilibrium constant: from Gibbs free energies of formation. The IAP could then be determined from a water analysis, and the saturation index calculated.
WHAT’S WRONG WITH THIS APPROACH? • Dissolved Al is not routinely determined in natural waters. • When determined, Al is often below detection limit, or so low that accurate analysis is difficult. • Much of the Al present is probably not actually dissolved, but in colloidal form. • The dissolved Al needs to be converted to free Al3+ by calculation.
INCONGRUENT DISSOLUTION • Aluminosilicate minerals usually dissolve incongruently, e.g., 2KAlSi3O8 + 2H+ + 9H2O Al2Si2O5(OH)4 + 2K+ + 4H4SiO40 • As a result of these factors, relations among solutions and aluminosilicate minerals are often depicted graphically on a type of mineral stability diagram called an activity diagram.
ACTIVITY DIAGRAMS: THE K2O-Al2O3-SiO2-H2O SYSTEM We will now calculate an activity diagram for the following phases: gibbsite {Al(OH)3}, kaolinite {Al2Si2O5(OH)4}, pyrophyllite {Al2Si4O10(OH)2}, muscovite {KAl3Si3O10(OH)2}, and K-feldspar {KAlSi3O8}. The axes will be aK+/aH+ vs. aH4SiO40. The diagram is divided up into fields where only one of the above phases is stable, separated by straight line boundaries.
Activity diagram showing the stability relationships among some minerals in the system K2O-Al2O3-SiO2-H2O at 25°C. The dashed lines represent saturation with respect to quartz and amorphous silica.
A preliminary mapping of the approximate relative locations where we would expect the stability fields of the phases of interest to plot based on their compositions.
GIBBSITE/KAOLINITE BOUNDARY - I The reactions are always written to conserve Al in solid phases: 2Al(OH)3(s) + 2H4SiO40 Al2Si2O5(OH)4 + 5H2O rG° = (-3800) + 5(-237.13) - 2(-1151) - 2(-1316.6) = -50.45 kJ mol-1
GIBBSITE/KAOLINITE BOUNDARY - II But the equilibrium constant is written: So this plots as a vertical boundary, independent of aK+/aH+.
The first boundary is plotted on this diagram. At this point, we do not know where the gibbsite/ kaolinite boundary will terminate, so we draw it along the length of the diagram.
KAOLINITE/PYROPHYLLITE BOUNDARY - I Once again, Al is conserved: Al2Si2O5(OH)4 Al2Si4O10(OH)2
KAOLINITE/PYROPHYLLITE BOUNDARY - I Once again, Al is conserved: Al2Si2O5(OH)4+ 2H4SiO40 Al2Si4O10(OH)2 + 5H2O rG° = (-5275) + 5(-237.13) - (-3800) - 2(-1316.6) = -27.45 kJ mol-1
KAOLINITE/PYROPHYLLITE BOUNDARY - II But the equilibrium constant is written: So this also plots as a vertical boundary, independent of aK+/aH+.
The second vertical boundary is also plotted on the diagram. Like the first, we don’t yet know where it will terminate, so we draw it across the length of the diagram.
GIBBSITE/MUSCOVITE BOUNDARY - I 3Al(OH)3(s) KAl3Si3O10(OH)2
GIBBSITE/MUSCOVITE BOUNDARY - I 3Al(OH)3(s) + 3H4SiO40 + K+ KAl3Si3O10(OH)2 + H+ + 9H2O rG° = (-5606) + (0) + 9(-237.13) - 3(-1151) - 3(-1316.6) - (-283.27) = -54.10 kJ mol-1
GIBBSITE/MUSCOVITE BOUNDARY - II But the equilibrium constant is written:
GIBBSITE/MUSCOVITE BOUNDARY - II But the equilibrium constant is written: So this plots as a straight line with a slope of -3.
KAOLINITE/MUSCOVITE BOUNDARY - I 3Al2Si2O5(OH)4 + 2K+ 2KAl3Si3O10(OH)2 + 2H+ + 3H2O rG° = 2(-5606) + 2(0) + 3(-237.13) - 3(-3800) - 2(-283.27) = 43.15 kJ mol-1
KAOLINITE/MUSCOVITE BOUNDARY - II This boundary plots as a horizontal line, independent of silicic acid activity.
The horizontal muscovite/ kaolinite boundary has now been added. At this point, we do not know whether the muscovite/kaolinite boundary will first intersect the kaolinite/pyrophyllite boundary, or whether the muscovite/kaolinite boundary will first intersect the muscovite/K-feldspar boundary that we have yet to draw. 3.78
K-FELDSPAR/MUSCOVITE BOUNDARY - I 3KAlSi3O8 +2H+ + 12H2O KAl3Si3O10(OH)2 + 2K+ + 6H4SiO40 rG° = (-5606) + 2(-283.27) + 6(-1316.6) - 3(-3767) - 2(0) - 12(-237.13) = 74.42 kJ mol-1
K-FELDSPAR/MUSCOVITE BOUNDARY - II So this plots as a straight line with a slope of -3.
When we plot the K-feldspar/ muscovite boundary quantitatively, we see that it intersects the horizontal muscovite/kaolinite boundary before the latter intersects the kaolinite/pyrophyllite boundary.
K-FELDSPAR/KAOLINITE BOUNDARY - I 2KAlSi3O8 +2H+ + 9H2O Al2Si2O5(OH)4 + 2K+ + 4H4SiO40 rG° = (-3800) + 2(-283.27) + 4(-1316.6) - 2(-3767) - 2(0) - 9(-237.13) = 35.23 kJ mol-1
K-FELDSPAR/KAOLINITE BOUNDARY - II So this plots as a straight line with a slope of -2.
K-FELDSPAR/PYROPHYLLITE BOUNDARY - I 2KAlSi3O8 Al2Si4O10(OH)2
K-FELDSPAR/PYROPHYLLITE BOUNDARY - I 2KAlSi3O8 +2H+ + 4H2O Al2Si4O10(OH)2 + 2K+ + 2H4SiO40 rG° = (-5275) + 2(-283.27) + 2(-1316.6) - 2(-3767) - 2(0) - 4(-237.13) = 7.78 kJ mol-1
K-FELDSPAR/PYROPHYLLITE BOUNDARY - II So this plots as a straight line with a slope of -1.