Download
1 / 16
160 likes | 300 Views
INTERPRETING REGRESSION COEFFICIENTS. OUTLINE. Back to Basics Form: The Regression Equation Strength: PRE and r 2 The Correlation Coefficient r Significance: Looking Ahead Example 1: Democracy in Latin America Example 2: Wine Consumption and Heart Disease. BACK TO BASIC CONCEPTS

E N D
OUTLINE • Back to Basics • Form: The Regression Equation • Strength: PRE and r2 • The Correlation Coefficient r • Significance: Looking Ahead • Example 1: Democracy in Latin America • Example 2: Wine Consumption and Heart Disease
BACK TO BASIC CONCEPTS PRE = (E1 – E2)/E1 = 1 – E2/E1 E1 = Σ(Y – Y)2 Rule for “predicting” values of Y, given knowledge of X: Yhati = a + bXi
E2 = Σ (Yi – Ŷ)2 that is, sum of squared differences between observed values of Y and predicted values of Y (values of Y as “predicted” by the regression equation) Thus the elements of PRE.
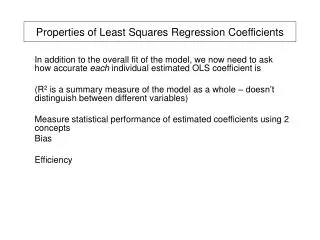
STRENGTH OF ASSOCIATION Symbol = r2 = PRE = (E1 – E2)/E1 = (total variance – unexplained variance)/total variance Varies from 0 to 1 Some back-of-the-envelope thresholds: 0.10, 0.30, 0.50+
FOCUSING ON FORM • As given by equation Ŷi = a + bXi • Constant a = intercept = predicted value of Y when X = 0 • Coefficient b = slope = average change in Y • for change in X • Magnitude (large or small) • Sign (positive or negative) • Key to much interpretation
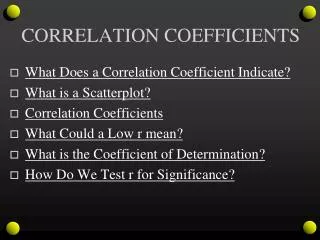
THE CORRELATION COEFFICIENT Symbol = r Summary statement of form (from sign) and indirect statement of strength r = square root of r2, varies from –1 to +1 subject to over-interpretation useful for preliminary assessment of association Symmetrical no matter which variable is X and which is Y (note: slope b is not symmetrical)
ON THE CORRELATION COEFFICIENT r Analogous to slope b (with removal of intercept a) The “standardized regression coefficient,” or beta weight: β= b (stand.dev. X/stand.dev. Y) employs slope, values, and dispersion of variables thus a “standardized” slope Question: How much action on Y do you get from X? In bivariate (or “simple”) regression, β = r
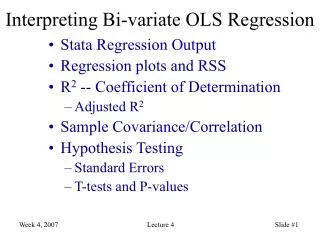
LOOKING AHEAD: MEASURING SIGNIFICANCE 1. Testing the null hypothesis: F = r2(n-2)/(1-r2) 2. Standard errors and confidence intervals: Dependent on desired significance level Bands around the regression line 95% confidence interval ±1.96 x SE
Coefficients for Regression of N Electoral Democracies (Y) on Change Over Time (X): a = -1.427 b = +.126 r = + .883 r2 = .780, Adjusted r2 = .777 Standard error of slope = .0067 95% confidence interval for slope = (.0067)x1.96 = ± .0013 setting confidence bands at .113 and .140 F for equation = 350.91, p < 0.000
Interpreting the Equation • N democracies = - 1.427 + .126 year • intercept = nonsense, but allows calculation of year that predicted value of Y would be zero, in this case 1910 • slope = +.126 so, one additional democracy every eight years • and by 2000, total 11-12 democracies • PRE = .777
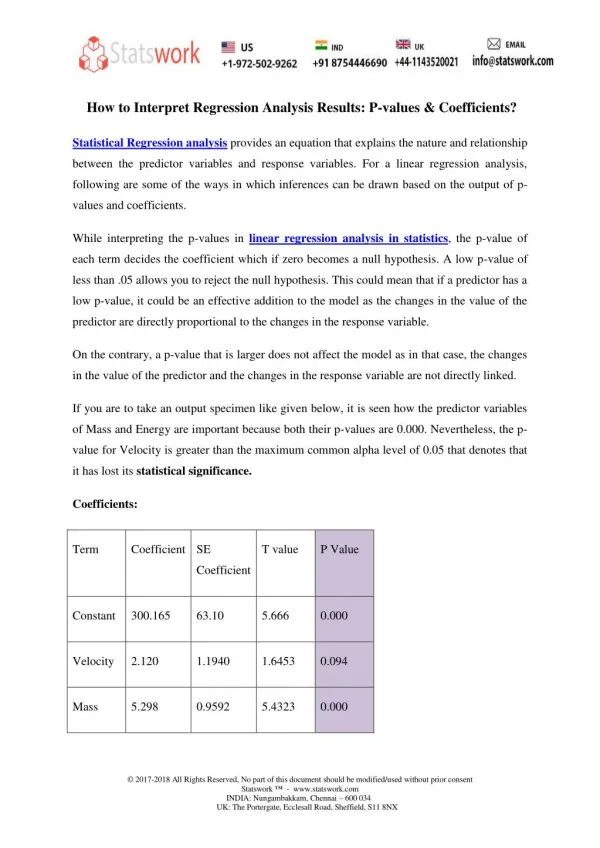
Example 2: Wine and Heart Disease Data in Lectures 5-6 X = per capita annual consumption of alcohol from wine, in liters Y = deaths from heart disease, per 100,000 people Equation: Ŷ = 260.6 - 22.97 X r = - 0.843 What’s the interpretation?