Download
1 / 88
880 likes | 965 Views
Explore the impacts of overpopulation, air pollution, ozone depletion, energy consumption, water wars, toxins, pesticides, and deforestation on our planet. Learn about environmental racism, industrial disasters, global warming, and factory farming.

E N D
Causes and Consequences of Environmental Degradation Martin Donohoe
Am I Stoned? A 1999 Utah anti-drug pamphlet warns: “Danger signs that your child may be smoking marijuana include excessive preoccupation with social causes, race relations, and environmental issues”
Overpopulation World population - exponential growth 1 billion in 1800 2.5 billion in 1950 6 billion in 2000 7 billion in 2011
Overpopulation Africa, Asia, and Latin America primarily affected Causes: Poverty Women’s rights issues impaired access to reproductive health care and education political/legal/economic/social marginalization
Health Effects of Air Pollution Causes approximately 60,000 - 75,000 premature deaths/yr. in U.S. 656,000 in China Over 2 million worldwide
Health Effects of Air Pollution MI CHF Ventricular arrythmias Asthma/COPD PVD Cerebrovascular disease Multiple other illnesses
Air Pollution Indoor combustion of coal and biomass for cooking, heating and food preservation 3 billion people worldwide 2 million deaths/yr Tobacco smoke 5.4 million deaths/yr worldwide (1/10 deaths)
Air Pollution: The Good News • Reductions in air pollution under Clean Air Act Account for up to 15% of overall increase in life expectancy in major U.S. metropolitan areas • Saved 160,000 lives in 2010
Effects of Ozone Destruction Ozone hole over Antarctic (2½X size of Europe) Shrinking Increased cataracts (UV damage) Increased lifetime melanoma risk 1/1500 - 1930 1/68 - today
US Energy Consumption by Fuel Oil – 37% - peak oil production expected 2014 Natural gas – 24% Coal – 22% - peak coal production 1920 Nuclear – 8.5% Renewables (mostly hydroelectric and biomass; small amounts of geothermal, wind, and solar) – 7.3%
Oil and War Countries that export oil are >40 times more likely to be engaged in civil war than those that do not Gulf Wars I and II The Future – Water Wars
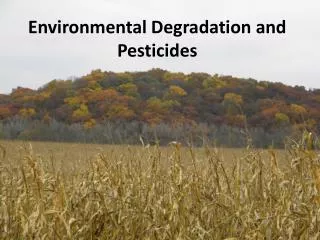
Toxins/Pesticides 6 trillion tons of over 85,000 chemicals produced annually More than 90% have never been screened for toxicity Over 2 billion lbs/yr pesticides in US Almost 7 lbs/person/yr
Pesticides EPA: U.S. farm workers suffer up to 300,000 pesticide-related acute illnesses and injuries per year 25 million cases/yr worldwide NAS: Pesticides in food could cause up to 1 million cancers in the current generation of Americans WHO: 1,000,000 people killed by pesticides over the last 6 years
Health Effects of Pesticides Autism Parkinson’s Disease Alzheimer’s disease Diabetes Obesity (with prenatal exposure) Depression ADHD Endocrine/reproductive effects
Toxic Pollutants 85,000 known or suspected hazardous waste sites in the U.S. Environmental Racism Waste dumps/incinerators more common in lower SES neighborhoods “Cancer Belt” (Baton Rogue to New Orleans)
Infamous Industrial Disasters Minimata, Japan Love Canal Bhopal, India Chernobyl, USSR
Infamous Industrial Disasters Alaska, Exxon Valdez, 1989 2006 BP Alaskan pipeline rupture 2010 BP Gulf disaster 2011 – Yellowstone pipe rupture
Deforestation Tropical forests constitute 7% of land surface area, contain > 50% of plant and animal species Majority of tropical forests destroyed One acre of world’s forest cut down every second 50% of global wetlands destroyed (54% in U.S.)
Deforestation Historical-Easter Island (Polynesians), Middle East, U.S. Southwest (Anasazi Indians) Contemporary-Mauritania, Ethiopia, Haiti deforested-Philippines and Thailand are now net importers of forest products, looking at Latin America
Deforestation: Causes New agricultural settlements (overpopulation, poverty, unsustainable farming practices) Logging Oil and gas exploration Cattle ranching Drug cultivation
Consequences of Global Warming 160,000 deaths and 5.5 million disability-adjusted life years lost per year WHO, UN Environment Program Expected to double by 2020
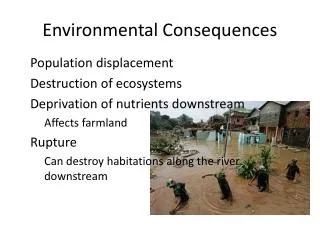
Consequences of Global Warming • Polar icecaps/glaciers/Greenland ice sheet/Himalayas/permafrost melting, sea levels rising • ↑ weather extremes/natural disasters/insurance claims • ↑ infectious diseases
Global Warming The top 1/5 of the world’s largest 145 countries account for 63% of global C02 emissions (lowest 1/5 = 2%) Countries most affected are those least responsible Climate refugees Disappearing locales: Tuvalu, Vanuatu, Kivalina (Alaska), Male (Maldives)
Agriculture Global per capita cropland down over 50% from 1961 to present Soil erosion exceeds soil formation Decreasing crop diversity/genetic diversity Consequences: vulnerability to disease, huge crop losses (e.g., Irish potato famine)
Factory Farming Factory farms have replaced industrial factories as the # 1 polluters of American waterways Agriculture accounts for 70% of U.S. antibiotic use CDC: “Antibiotic use in food animals is the dominant source of antibiotic resistance among food-borne pathogens.”
Overfishing • Fisheries collapsing • Coral reef destruction • Aquaculture
Maldistribution of Wealth 500 billionaires worldwide top 250 billionaires worth $1 trillion, the combined income of bottom 2.5 billion people (45% of world’s population)
Maldistribution of Wealth U.S: Richest 1% of the population owns 50% of the country’s wealth -poorest 90% own 30%-widest gap of any industrialized nation Associated with 880,000 deaths per year over expected number if gap was same as in Western European nations
Maldistribution of wealth Less than 4% of the combined wealth of the 225 richest individuals in the world would pay for ongoing access to basic education, health care (including reproductive health care), adequate food, safe water, and adequate sanitation for all humans (UNDP)
Declaration of Independence “All men are created equal.”
George Orwell “Some people are more equal than others”
Voltaire “The comfort of the rich rests upon an abundance of the poor”
Racial Disparities Economic Educational Criminal justice system involvement Discrimination
Racial Disparities: Health Care Higher maternal and infant mortality Higher death rates for most diseases Shorter life expectancies Less health insurance Fewer diagnostic tests / therapeutic procedures
Racial Disparities: Health Care Equalizing the mortality rates of whites and African-Americans would have averted 686,202 deaths between 1991 and 2000 Whereas medical advances averted 176,633 deaths AJPH 2004;94:2078-2081
Overconsumption (Affluenza) U.S. = 6.3% of world’s population Own 50% of the world’s wealth U.S. responsible for:-25% of world’s energy consumption-33% of paper use-72% of hazardous waste production (1 ton/person/year)
But are we happier? Workloads increasing, vacation and free time decreasing U.S.: Only OECD country not to guarantee paid vacation and sick leave Erosion of social capital
Economic Stagnation Inflation-adjusted income of the median U.S. household 1989 - $54,600 1997 - $49,000 2004 - $44,389 2009 - $49,777 2011 - $51,860 Financial Crisis / Recession
Exorbitant CEO Pay CEO salaries up 500% since 1980 The average CEO makes 300-400X the salary of the average U.S. worker (1960 - 41X; 1980 - 42X) Mexico 45:1 Britain 25:1 Germany 11:1 Japan 10:1
The “Global Economy” 53 of the world’s 100 largest economies are private corporations; 47 are countries Wal-Mart is larger than Israel and Greece AT&T is larger than Malaysia and Ireland