Download
1 / 3
30 likes | 37 Views
Data mining technique has been considered as useful means for recognize patterns and accumulate of large set of data. This method is basically used to extract the unknown pattern from the large set of data as real time applications. It is an approximate intellect discipline which has appeared valuable tool for data analysis, new knowledge recognition and independent decision making. The speech recognition is also the most important research area to find the speech signal by the computer. To evolve the recognition of the continuous speech signal, a speech segmentation, feature extraction and clustering techniques are used. The unlabelled data from the large dataset can be categorized initially in an unaided fashion by using cluster analysis. The result of the clustering process and efficiency of its application are generally resolved through algorithms. There are various algorithms which are used to solve this problem. In this research paper two important clustering algorithms namely canter points based K Means and representative object based FCM Fuzzy C Means clustering algorithms are compared. The Hidden morkov model and Gaussian mixture model are the most suitable acoustic models are used to scale the continuous speech signal and recognize the corresponding text data. Priyanka Jadhav | Rasika Patil "Analysis of Clustering technique" Published in International Journal of Trend in Scientific Research and Development (ijtsrd), ISSN: 2456-6470, Volume-2 | Issue-4 , June 2018, URL: https://www.ijtsrd.com/papers/ijtsrd15616.pdf Paper URL: http://www.ijtsrd.com/computer-science/data-miining/15616/analysis-of-clustering-technique/priyanka-jadhav<br>

E N D
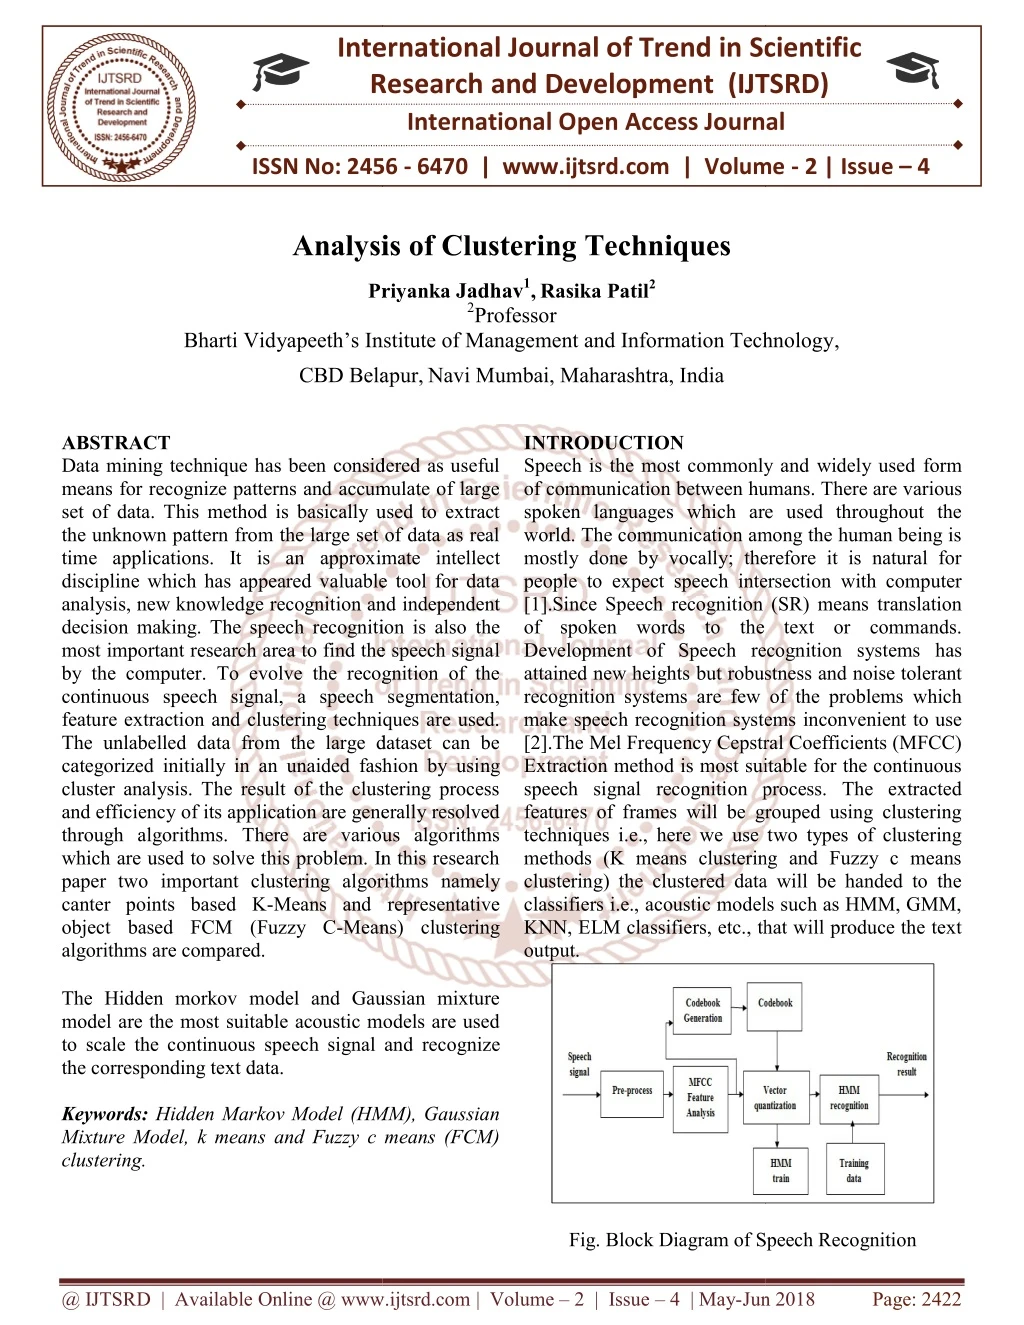
International Research Research and Development (IJTSRD) International Open Access Journal International Journal of Trend in Scientific Scientific (IJTSRD) Access Journal ISSN No: 2456 ISSN No: 2456 - 6470 | www.ijtsrd.com | Volume 6470 | www.ijtsrd.com | Volume - 2 | Issue – 4 Analysis Analysis of Clustering Techniques Priyanka Jadhav1,Rasika Patil2 2Professor Vidyapeeth’s Institute of Management and Information Technology Vidyapeeth’s Institute of Management and Information Technology, Priyanka Bharti Vidyapeeth’s Institute of Management and Information Technology CBD Belapur, CBD Belapur,Navi Mumbai, Maharashtra, India ABSTRACT Data mining technique has been considered as useful means for recognize patterns and accumulate of large set of data. This method is basically used to extract the unknown pattern from the large set of data as real time applications. It is an approximate intellect discipline which has appeared valuable tool for data analysis, new knowledge recognition and decision making. The speech recognition is also most important research area to find the speech signa by the computer. To evolve the recognition of the continuous speech signal, a speech segmentation, feature extraction and clustering techniques are used. The unlabelled data from the large dataset can be categorized initially in an unaided fashion by usi cluster analysis. The result of the clustering process and efficiency of its application are generally resolved through algorithms. There are various algorithms which are used to solve this problem. In this research paper two important clustering algori canter points based K-Means and representative object based FCM (Fuzzy C-Means) clustering algorithms are compared. The Hidden morkov model and Gaussian mixture model are the most suitable acoustic models are used to scale the continuous speech signal and recognize the corresponding text data. Keywords: Hidden Markov Model (HMM), Gaussian Mixture Model, k means and Fuzzy c means (FCM) clustering. INTRODUCTION Speech is the most commonly and widely used of communication between humans. There are spoken languages which are used throughout the world. The communication among the human being is mostly done by vocally; therefore it is natural for people to expect speech intersection with computer [1].Since Speech recognition ( of spoken words to the text or commands. Development of Speech recognition systems has attained new heights but robustness recognition systems are few make speech recognition systems [2].The Mel Frequency Cepstral Coefficients (MFCC) Extraction method is most suitable for the continuous speech signal recognition process. The extracted features of frames will be grouped using clustering techniques i.e., here we use t methods (K means clustering and Fuzzy c means clustering) the clustered data will be handed to the classifiers i.e., acoustic models such as HMM, GMM, KNN, ELM classifiers, etc., that will produce the text output. Data mining technique has been considered as useful means for recognize patterns and accumulate of large set of data. This method is basically used to extract the unknown pattern from the large set of data as real Speech is the most commonly and widely used form humans. There are various spoken languages which are used throughout the world. The communication among the human being is mostly done by vocally; therefore it is natural for expect speech intersection with computer [1].Since Speech recognition (SR) means translation spoken words to the text or commands. Speech recognition systems has but robustness and noise tolerant approximate intellect discipline which has appeared valuable tool for data analysis, new knowledge recognition and independent decision making. The speech recognition is also the most important research area to find the speech signal To evolve the recognition of the continuous speech signal, a speech segmentation, feature extraction and clustering techniques are used. The unlabelled data from the large dataset can be categorized initially in an unaided fashion by using cluster analysis. The result of the clustering process and efficiency of its application are generally resolved through algorithms. There are various algorithms which are used to solve this problem. In this research paper two important clustering algorithms namely Means and representative of the problems which make speech recognition systems inconvenient to use The Mel Frequency Cepstral Coefficients (MFCC) Extraction method is most suitable for the continuous speech signal recognition process. The extracted features of frames will be grouped using clustering techniques i.e., here we use two types of clustering methods (K means clustering and Fuzzy c means clustering) the clustered data will be handed to the classifiers i.e., acoustic models such as HMM, GMM, KNN, ELM classifiers, etc., that will produce the text Means) clustering The Hidden morkov model and Gaussian mixture model are the most suitable acoustic models are used ech signal and recognize Hidden Markov Model (HMM), Gaussian Mixture Model, k means and Fuzzy c means (FCM) Fig. Block Diagram of Speech Recognition am of Speech Recognition @ IJTSRD | Available Online @ www.ijtsrd.com @ IJTSRD | Available Online @ www.ijtsrd.com | Volume – 2 | Issue – 4 | May-Jun 2018 Jun 2018 Page: 2422
International Journal of Trend in Scientific Research and Development (IJTSRD) ISSN: 2456-6470 Cluster analysis is also recognized as an important technique for classifying data, finding clusters of a ssssdataset based on similarities in the same cluster and dissimilarities between different clusters [3]. Putting each point of the dataset to exactly one cluster is the basic of the conventional clustering method whereas clustering algorithm actually partitions unlabelled set of data into different groups according to the similarity? As such there are many algorithms that are proposed to improve the clustering performance. Clustering is basically considered as classification of similar objects, it is precisely partitioning of datasets into clusters so that data in each cluster shares some common trait. In this paper we are go through the comparative study between K-mean and Fuzzy C-mean. Overview of Continuous Speech Recognition: To develop the recognition of the continuous speech signal, a speech segmentation, feature extraction and clustering techniques are used. 1. Speech Segmentation: Speech segmentation is the process of identifying the boundaries between words, syllables, or phonemes in spoken natural languages. The term applies both to the mental processes used by humans, and to artificial processes of natural language processing. 2.Feature Extraction: Feature Extraction method, the segmented speech signal is parameterized by MFCC. The goal is to extract a number of parameters from the signal that has a maximum of information relevant for the classification. The Mel Coefficients (MFCC) Extraction method is most suitable for the continuous speech signal recognition process. It is a coefficient that collectively makes up an MFC. They are of cepstral representation of the audio clip.[7] The extracted features of frames will be grouped using clustering techniques i.e., here we use two types of clustering methods .The clustered data will be handed to the classifiers i.e., acoustic models such as HMM ,GMM, KNN, ELM classifiers ,etc., That will produce the text output.[6] 3.Clustering Technique: There are two types of clustering technique: K-Mean Clustering Fuzzy C-Mean Clustering K-Mean Clustering: K-means quantization, originally from signal processing, that is popular for cluster analysis in data mining. K-means clustering aims to partition n observations into k clusters in which each observation belongs to the cluster with the nearest mean, serving as a prototype of the cluster. This results in a partitioning of the data space into Voronoi In mathematics, a Voronoi diagram is a partitioning of a plane into regions based on distance to points in a specific subset of the plane. That set of points (called seeds, sites, or generators) is specified beforehand, and for each seed there is a corresponding region consisting of all points closer to that seed than to any other. Algorithm: Step 1 : SetK- Randomly select k center points, Step 2 : Initialization-Observation are assigned to the closest center point. Step 3 : Classification– To examine each point in the dataset and assign it to the cluster whose center point is nearest to it. Step 4 : Center point’s calculation– When each point in the data set is assigned to a cluster, it is needed to recalculate the new k center points using: Vi=(1/ci) ∑ x Step 5 : Convergence criteria– The steps of (3) and (4) require to be repeated until no point changes its cluster assignment or until the center points no longer move clustering is a method of vector cells. [4] ?? ??? ? Frequency Cepstral derived from a type Fig. K Mean Clustering Technique Fuzzy C-Mean Clustering: Fuzzy C-Means (FCM) is a type of clustering. It is an unsupervised algorithm which allows one piece of data to belong to two or more clusters. With fuzzy c- means, the centre points of a cluster are calculated as the mean of all points, weighted by their degree of belonging to the cluster. [8]By iteratively updating the @ IJTSRD | Available Online @ www.ijtsrd.com | Volume – 2 | Issue – 4 | May-Jun 2018 Page: 2423
International Journal of Trend in Scientific Research and Development (IJTSRD) ISSN: 2456-6470 cluster centres and the membership grades for each data point. Performance depends on initial centre points. For a robust approach there are two ways which is described below. 1. Using an algorithm to resolute all of the centre points. 2. Run FCM several times each starting with different initial centre points. Fuzzy C-means Clustering (FCM) is also known as Fuzzy ISODATA. The FCM adopts fuzzy partitioning to make each given value of data input between0 and 1 in order to determine the degree of its belonging to a group. FCM is a repetition algorithm. The aim of FCM is to find cluster centres (centre points)that minimize a dissimilarity function. Algorithm: Step 1 : Initialization - Randomly initialized the membership matrix using this equation. ∑ = ? 1 µj (xi) = 1 i =1,2…k Fig. Fuzzy K Mean Clustering Technique Conclusion: The k means clustering algorithm is only suited for the different or well separated data set and it requires a presumably specification of the number of cluster centres. The k mean does not work well with cluster of different size and different density But Fuzzy c means clustering gives the best result for concurred data set and comparatively better than k-means algorithm. Unlike k-means where data point must exclusively belong to one cluster centre here data point is assigned membership to each cluster centre as a result of which data point may belong to more than one cluster centre. REFERENCES 1.Pukhraj Shrishrimal, R. R. Deshmukh, and Vishal Waghmare “Indian Language Speech Database: A Review”. International Journal of Computer Application (IJCA), Vol 47, No. 5, pp. 17-21, 2012. 2.Chao Huang, Eric Chang, Tao Chen “Accent Issues in Large Vocabulary Continuous Speech Recognition (LVCSR)”, Microsoft Research China, MSR-TR-2001-69, Pp.1-27 3.V. S. Rao and Dr. S. Vidyavathi, “Comparative Investigations and Performance Analysis of FCM and MFPCM Algorithms on Iris data”, Indian Journal of Computer Science and Engineering, vol.1, no.2, 2010 pp. 145-151. 4.L. R. Rabiner and B. H. Juang. Fundamentals of Speech Recognition. Englewood Cliffs, NJ: Prentice-Hall, 1993. 5.A Review on clustering techniques in Continuous Speech Recognition Kalamani M, Valarmathy S, Mohan R, AnithaS. 6.A. Rakhlin and A. Caponnetto, ―Stability of K- Means clustering, Advances in Neural Information Processing Systems, MIT Press, Cambridge, MA, 2007, pp. 216–222. . 7.https://en.wikipedia.org/wiki/K-means clustering 8.https://en.wikipedia.org/wiki/Mel- requency_cepstru ? Step 2 : Calculate - Calculate the centroid using this equation. ∑i[µj (xi)]mxi C j = ∑i[µj (xi)]m Step 3 : Calculate dissimilarity between the data points and centre points using Euclidean distance. Di =√ (X2-X1)2 + (Y2 – Y1)2 Step 4 : Update new Membership matrix using this equation. 1 1/m-1 µj ( xi ) = dji ∑ = ? 11 1/m-1 dki Here m is a fuzzification parameter. The range of m is (1.25, 2) Step 5 : Go back to step 2, when centre points are not changing. ? @ IJTSRD | Available Online @ www.ijtsrd.com | Volume – 2 | Issue – 4 | May-Jun 2018 Page: 2424