Download
1 / 7
70 likes | 85 Views
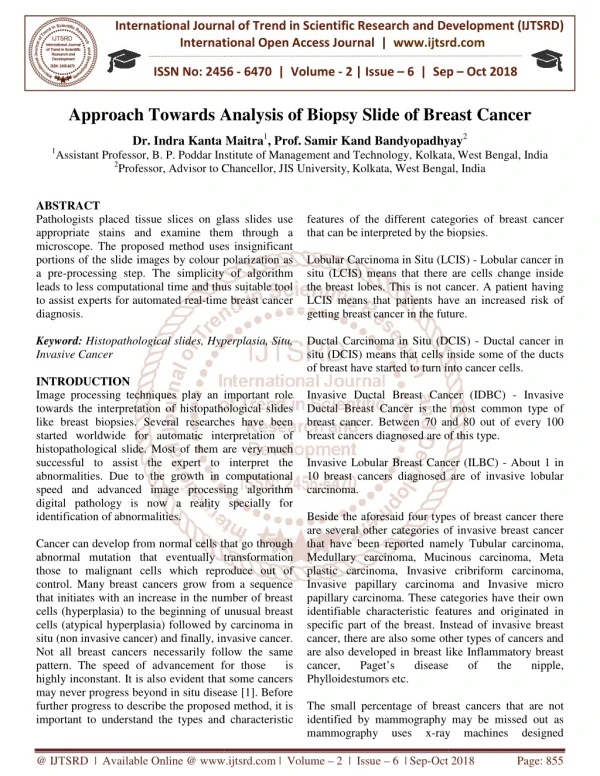
Pathologists placed tissue slices on glass slides use appropriate stains and examine them through a microscope. The proposed method uses insignificant portions of the slide images by colour polarization as a pre processing step. The simplicity of algorithm leads to less computational time and thus suitable tool to assist experts for automated real time breast cancer diagnosis. Dr. Indra Kanta Maitra | Prof. Samir Kand Bandyopadhyay "Approach Towards Analysis of Biopsy Slide of Breast Cancer" Published in International Journal of Trend in Scientific Research and Development (ijtsrd), ISSN: 2456-6470, Volume-2 | Issue-6 , October 2018, URL: https://www.ijtsrd.com/papers/ijtsrd18734.pdf Paper URL: http://www.ijtsrd.com/computer-science/other/18734/approach-towards-analysis-of-biopsy-slide-of-breast-cancer/dr-indra-kanta-maitra<br>

E N D
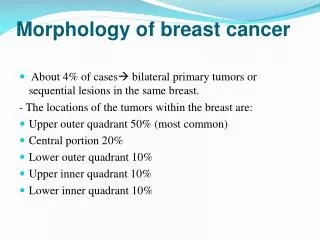
International Journal of Trend in International Open Access Journal International Open Access Journal | www.ijtsrd.com International Journal of Trend in Scientific Research and Development (IJTSRD) Research and Development (IJTSRD) www.ijtsrd.com ISSN No: 2456 ISSN No: 2456 - 6470 | Volume - 2 | Issue – 6 | Sep 6 | Sep – Oct 2018 Approach Towards Analysis Analysis of Biopsy Slide of Breast Samir Kand Bandyopadhyay2 P. Poddar Institute of Management and Technology, Kolkata,West Bengal, India Kolkata, West Bengal, India of Breast Cancer Dr. Indra Kanta Maitra Kanta Maitra1, Prof. Samir Kand Bandyopadhyay P. Poddar Institute of Management and Technology, Kolkata, Advisor to Chancellor, JIS University,Kolkata, West Bengal, India 1Assistant Professor, B. P. Poddar Institute of Management and Technology, Kolkata, 2Professor, Advisor to Chancellor, JIS University, ABSTRACT Pathologists placed tissue slices on glass slides use appropriate stains and examine them through a microscope. The proposed method uses insignificant portions of the slide images by colour polarization as a pre-processing step. The simplicity of algorithm leads to less computational time and thus suitable tool to assist experts for automated real-time breast cancer diagnosis. Keyword: Histopathological slides, Hyperplasia, Situ, Invasive Cancer INTRODUCTION Image processing techniques play an important role towards the interpretation of histopathological slides like breast biopsies. Several researches have been started worldwide for automatic interpretation of histopathological slide. Most of them are very successful to assist the expert to interpret the abnormalities. Due to the growth in computational speed and advanced image processing algorithm digital pathology is now a reality specially for identification of abnormalities. Cancer can develop from normal cells that go through abnormal mutation that eventually transformation those to malignant cells which reproduce out of control. Many breast cancers grow from a sequence that initiates with an increase in the number of breast cells (hyperplasia) to the beginning of unusual breast cells (atypical hyperplasia) followed by carcinoma in situ (non invasive cancer) and finally, invasive cancer. Not all breast cancers necessarily follow the same pattern. The speed of advancement for thos highly inconstant. It is also evident that some cancers may never progress beyond in situ disease [1]. Before further progress to describe the proposed method, it is important to understand the types and characteristic features of the different categories of breast cancer that can be interpreted by the biopsies. Lobular Carcinoma in Situ (LCIS) situ (LCIS) means that there are cells change inside the breast lobes. This is not cancer. A patient having LCIS means that patients have an increased risk of getting breast cancer in the future. Ductal Carcinoma in Situ (DCIS) situ (DCIS) means that cells inside some of the ducts of breast have started to turn into cancer cells. Invasive Ductal Breast Cancer (IDBC Ductal Breast Cancer is the most common type of breast cancer. Between 70 and 80 out of every 100 breast cancers diagnosed are of this type. Invasive Lobular Breast Cancer (ILBC) 10 breast cancers diagnosed are of invasive lobul carcinoma. Beside the aforesaid four types of breast cancer there are several other categories of invasive breast cancer that have been reported namely Tubular carcinoma, Medullary carcinoma, Mucinous carcinoma, Met plastic carcinoma, Invasive cribri Invasive papillary carcinoma and Invasive micro papillary carcinoma. These categories have their own identifiable characteristic features and originated in specific part of the breast. Instead of invasive breast cancer, there are also some ot are also developed in breast like Inflammatory breast cancer, Paget’s disease Phylloidestumors etc. The small percentage of breast cancers that are not identified by mammography may be missed out as mammography uses x-ray ray Pathologists placed tissue slices on glass slides use appropriate stains and examine them through a microscope. The proposed method uses insignificant ategories of breast cancer that can be interpreted by the biopsies. r polarization as Lobular Carcinoma in Situ (LCIS) - Lobular cancer in situ (LCIS) means that there are cells change inside the breast lobes. This is not cancer. A patient having processing step. The simplicity of algorithm leads to less computational time and thus suitable tool time breast cancer have an increased risk of getting breast cancer in the future. Ductal Carcinoma in Situ (DCIS) - Ductal cancer in situ (DCIS) means that cells inside some of the ducts of breast have started to turn into cancer cells. Histopathological slides, Hyperplasia, Situ, Image processing techniques play an important role towards the interpretation of histopathological slides like breast biopsies. Several researches have been started worldwide for automatic interpretation of Most of them are very much successful to assist the expert to interpret the abnormalities. Due to the growth in computational speed and advanced image processing algorithm digital pathology is now a reality specially for Invasive Ductal Breast Cancer (IDBC) - Invasive Ductal Breast Cancer is the most common type of breast cancer. Between 70 and 80 out of every 100 breast cancers diagnosed are of this type. Invasive Lobular Breast Cancer (ILBC) - About 1 in 10 breast cancers diagnosed are of invasive lobular Beside the aforesaid four types of breast cancer there are several other categories of invasive breast cancer that have been reported namely Tubular carcinoma, Medullary carcinoma, Mucinous carcinoma, Meta plastic carcinoma, Invasive cribriform carcinoma, Invasive papillary carcinoma and Invasive micro papillary carcinoma. These categories have their own identifiable characteristic features and originated in specific part of the breast. Instead of invasive breast ancer can develop from normal cells that go through abnormal mutation that eventually transformation those to malignant cells which reproduce out of control. Many breast cancers grow from a sequence that initiates with an increase in the number of breast hyperplasia) to the beginning of unusual breast cells (atypical hyperplasia) followed by carcinoma in invasive cancer) and finally, invasive cancer. Not all breast cancers necessarily follow the same pattern. The speed of advancement for those is highly inconstant. It is also evident that some cancers may never progress beyond in situ disease [1]. Before further progress to describe the proposed method, it is important to understand the types and characteristic her types of cancers and are also developed in breast like Inflammatory breast cancer, Paget’s disease of of the the nipple, nipple, The small percentage of breast cancers that are not identified by mammography may be missed out as machines machines designed designed @ IJTSRD | Available Online @ www.ijtsrd.com www.ijtsrd.com | Volume – 2 | Issue – 6 | Sep-Oct 2018 Oct 2018 Page: 855
International Journal of Trend in Scientific Research and Development (IJTSRD) ISSN: 2456 International Journal of Trend in Scientific Research and Development (IJTSRD) ISSN: 2456 International Journal of Trend in Scientific Research and Development (IJTSRD) ISSN: 2456-6470 specially to image the breasts. Breast MRI also requires special equipment for breast imaging. Higher-quality images are produced by dedicated breast MRI equipment than by general purpose machines designed for head, chest or abdomi scanning. It is important that screening MRIs are done at facilities that are capable of performing an MRI guided breast biopsy at the time of the examination if abnormalities are found. Sometime interpretations of mammograms can be difficult because a normal breast of different women may vary significantly. Also, the appearance of an image may be compromised if there is powder or salve on the breasts or if they have undergone breast surgery. Some breast cancers are difficult to visualize. Not all cancers of the breast can be seen on mammography [2]. The proposed algorithm leads to less computational time and thus suitable tool to assist experts for automated real-time breast cancer diagnosis. Literature Review The histopathological slide image analysis of digital microscope is a young subject with enormous potentiality. There are several interesting works that have been carried out by different research groups. But most of the research is concentrated in the field of blood sample analysis and decision support system. In the field of tissue culture or more specifically cancer detection by biopsy slide is highly dependent on human intervention. Automatic CAD system development in this field has not initiated much. There are some researches but they are mostly theoretical in nature. In this paper, few of the researches are discussed below which are dealing with this related field. Some Researchers reported a computational method that modelled a type of brain cancer using topological properties of cells in the tissue image. They constructed the graphs based on the locations of cells within the image. They used the Waxman model in their experiment [3-5]. Researchers also classified [6-7] the breast cancer tissues using graph theory. These approaches t automatic detection of cancer actually failed because the types of cancers identified were complicated. specially to image the breasts. Breast MRI also requires special equipment for breast imaging. quality images are produced by dedicated breast MRI equipment than by general purpose machines designed for head, chest or abdominal MRI scanning. It is important that screening MRIs are done at facilities that are capable of performing an MRI- guided breast biopsy at the time of the examination if Other researchers introduced a Grid-enabled CAD to perform automatic analysis of imaged histopathology breast tissue specimens [8]. More than 100,000 digitized samples (1200 × 1200 pixels) were processed on the Grid. They analyzed results for 3744 issue samples, which were originated from four different institutions using diaminobenzidine (DAB) and hematoxylin staining. Other researchers introduced a Grid perform automatic analysis of imaged histopathology breast tissue specimens [8]. More than 100,000 digitized samples (1200 × 1200 pixels) were processed on the Grid. They analyzed results for 3744 breast tissue samples, which were originated from four different institutions using diaminobenzidine (DAB) and hematoxylin staining. Another researcher presented a computationally efficient method for analyzing H&E stained digital pathology slides with the objec diagnostically relevant vs. irrelevant regions [9]. Other Researcher proposed a computer aided diagnosis system dedicated to virtual microscopy based on stereo logy sampling and diffusion maps. The original strategy is presented, co stereological sampling methods based on test grids and data reduction methods based on diffusion maps, in order to build a knowledge image database. The practical application of the exposed methodology concerns virtual slides of breast tumors [10]. Proposed Method The proposed method is an introductory pre processing work towards the confirmation of breast cancer using histopathological slide of biopsy. Digital slide image analysis is a complex work and required long time to establish viable algori abnormalities in a slide without further human intervention. The proposed work is preliminary initiative towards the same. It identifies the abnormalities but as a pre-processing step it enhances the histopathological slide, so that, if a present, it will become more noticeable. It will make easy the search for abnormalities by the experts of this field. In the proposed work, free Tissue Blocks downloaded from OriGene Technologies [2] are used as dataset. In the experiments, breast cancer tissues from different patients and non- cancerous breast tissues from different normal females are considered. The sample images are 24-bit bitmap image with the size of 640X480 Pixels. The sample images provided by the technologies are coloured image. The coloured image is more informative but at the same time it will increase the complexity of the method towards analysis of the image. The 24 analysis of the image. The 24-bit bitmap can produce Another researcher presented a computationally efficient method for analyzing H&E stained digital pathology slides with the objective of discriminating diagnostically relevant vs. irrelevant regions [9]. Sometime interpretations of mammograms can be ause a normal breast of different women may vary significantly. Also, the appearance of an image may be compromised if there is powder or salve on the breasts or if they have undergone breast surgery. Some breast cancers are difficult to visualize. cancers of the breast can be seen on Other Researcher proposed a computer aided diagnosis system dedicated to virtual microscopy logy sampling and diffusion maps. The original strategy is presented, combining stereological sampling methods based on test grids and data reduction methods based on diffusion maps, in order to build a knowledge image database. The practical application of the exposed methodology concerns virtual slides of breast tumors [10]. The proposed algorithm leads to less computational time and thus suitable tool to assist experts for time breast cancer diagnosis. nalysis of digital microscope is a young subject with enormous potentiality. There are several interesting works that have been carried out by different research groups. But most of the research is concentrated in the field of The proposed method is an introductory pre- processing work towards the confirmation of breast cancer using histopathological slide of biopsy. Digital slide image analysis is a complex work and required long time to establish viable algorithm to detect the abnormalities in a slide without further human intervention. The proposed work is preliminary initiative towards the same. It identifies the processing step it enhances the histopathological slide, so that, if abnormalities present, it will become more noticeable. It will make easy the search for abnormalities by the experts of this ision support system. In the field of tissue culture or more specifically cancer detection by biopsy slide is highly dependent on Automatic CAD system development in this field has not initiated much. There are some researches but y are mostly theoretical in nature. In this paper, few of the researches are discussed below which are In the proposed work, free Tissue Blocks downloaded from OriGene Technologies [2] are used as dataset. In reast cancer tissues from different cancerous breast tissues from different normal females are considered. The sample bit bitmap image with the size of Some Researchers reported a computational method that modelled a type of brain cancer using topological ells in the tissue image. They constructed the graphs based on the locations of cells within the image. They used the Waxman model in 7] the breast cancer These approaches towards The sample images provided by the OriGene re coloured image. The coloured image is more informative but at the same time it will increase the complexity of the method towards automatic detection of cancer actually failed because the types of cancers identified were more more @ IJTSRD | Available Online @ www.ijtsrd.com www.ijtsrd.com | Volume – 2 | Issue – 6 | Sep-Oct 2018 Oct 2018 Page: 856
International Journal of Trend in Scientific Research and Development (IJTSRD) ISSN: 2456 International Journal of Trend in Scientific Research and Development (IJTSRD) ISSN: 2456 International Journal of Trend in Scientific Research and Development (IJTSRD) ISSN: 2456-6470 almost 16,777,216 number distinct colours shades which are virtually impossible to handle. So, conventionally almost all the medical image processing algorithms use the grey shade image to reduce the complexity of the method and preserve maximum information investigate. The grey image contains 256 numbers of grey shades to represent an image. The proposed method analyzed different alternative methods to convert the colour image to grey scale image. The most important factor here is to preserve the relative colour distance within here is to preserve the relative colour distance within almost 16,777,216 number distinct colours shades mpossible to handle. So, conventionally almost all the medical image processing algorithms use the grey shade image to reduce the complexity of the method and preserve maximum information the image colour domain. The Euclidean distance is the perfect method to covert the colour image to respective grey shade image. The relative colour distance will be preserved in the colour palette. Initially a grey colour palette i.e. GP is generated. It is known that the value of red, green and blue of grey colour palette. All are same for a particular instance of intensity of colour. The algorithm iteratively read the colour pixel (P) from the sample the colour information in terms of Red, Green and blue. he Euclidean distance is the perfect method to covert the colour image to respective grey shade image. The relative colour distance will be preserved in the colour palette. within within the the image image to to Initially a grey colour palette i.e. GP is generated. It is f red, green and blue of grey colour palette. All are same for a particular instance of intensity of colour. The algorithm iteratively read the colour pixel (P) from the sample image (I) and split the colour information in terms of Red, Green and s of grey shades to represent an image. The proposed method analyzed different alternative methods to convert the colour image to grey scale image. The most important factor Now the Euclidean distances (ED) are calculated for all the colour shade in the GP. distances (ED) are calculated for all the colour shade in the GP. The grey shade with lowest distance (ED and blue component of the pixel, ensuing the conversion from colour to grey sc terminate when all the pixels of the colour image are converted to grey scale. terminate when all the pixels of the colour image are converted to grey scale. terminate when all the pixels of the colour image are converted to grey scale. The grey shade with lowest distance (EDi) is selected and value of the grey shade is propagated to red, green and blue component of the pixel, ensuing the conversion from colour to grey scale image. The iteration will ) is selected and value of the grey shade is propagated to red, green ale image. The iteration will @ IJTSRD | Available Online @ www.ijtsrd.com www.ijtsrd.com | Volume – 2 | Issue – 6 | Sep-Oct 2018 Oct 2018 Page: 857
International Journal of Trend in Scientific Research and Development (IJTSRD) ISSN: 2456 International Journal of Trend in Scientific Research and Development (IJTSRD) ISSN: 2456 International Journal of Trend in Scientific Research and Development (IJTSRD) ISSN: 2456-6470 The proposed method is implemented using three loops. The outer loop is for height, inner loop is for width and the inner most loop is to traverse the grey scale palette. Assuming that height = width = n and grey palette is k. So, the running time of the algorithm is k.n the running time of the algorithm is order of n the running time of the algorithm is order of n2. The proposed method is implemented using three loops. The outer loop is for height, inner loop is for width and e the grey scale palette. Assuming that height = width = n and grey palette is k. The proposed method is implemented using three loops. The outer loop is for height, inner loop is for width and e the grey scale palette. Assuming that height = width = n and grey palette is k. So, the running time of the algorithm is k.n2. But the grey palette i.e. k is always 256, so, it is a constant. Hence, . But the grey palette i.e. k is always 256, so, it is a constant. Hence, The initial objective of the process is to eliminate the irrelevant object from the slide to make it more enhanced and clear. The final objective is to merge the similar objects in slide by colour initial objective will be achieved by increasing the contrast level of the slide by using a constant ( intensity shades. The final objective will be accomplished by colour determined by the central tendency of image. For simplicity, the average of intensity of colour can be used for thresholding which are already derived in previous algorithm. nitial objective of the process is to eliminate the irrelevant object from the slide to make it more enhanced and clear. The final objective is to merge the similar objects in slide by colour polarisation technique. The increasing the contrast level of the slide by using a constant ( intensity shades. The final objective will be accomplished by colour polarisation using a threshold (k) determined by the central tendency of image. For simplicity, the average of highest (MaxV) and lowest (MinV) sholding which are already derived in previous algorithm. sholding which are already derived in previous algorithm. nitial objective of the process is to eliminate the irrelevant object from the slide to make it more enhanced polarisation technique. The increasing the contrast level of the slide by using a constant (∆) with the polarisation using a threshold (k) highest (MaxV) and lowest (MinV) Finally, the inverse image is generated due to better understanding of the abnormalitiespresent in the sample image. Finally, the inverse image is generated due to better understanding of the abnormalitiespresent in the sample Finally, the inverse image is generated due to better understanding of the abnormalitiespresent in the sample @ IJTSRD | Available Online @ www.ijtsrd.com www.ijtsrd.com | Volume – 2 | Issue – 6 | Sep-Oct 2018 Oct 2018 Page: 858
International Journal of Trend in Scientific Research and Development (IJTSRD) ISSN: 2456 International Journal of Trend in Scientific Research and Development (IJTSRD) ISSN: 2456 International Journal of Trend in Scientific Research and Development (IJTSRD) ISSN: 2456-6470 The proposed method traverses the entire image. The outer loop is used for the height whereas the inner loop is for width. Assuming that, height = width = n. Then the running time of the algorithm is order of n for width. Assuming that, height = width = n. Then the running time of the algorithm is order of n for width. Assuming that, height = width = n. Then the running time of the algorithm is order of n2. The proposed method traverses the entire image. The outer loop is used for the height whereas the inner loop is The proposed method traverses the entire image. The outer loop is used for the height whereas the inner loop is Experimental Result The primary objective of the proposed method is to remove the huge amount of fat, connective tissue and gland tissue from the cancerous cells within the histopathological biopsy samples. The stage, intensity, type, future development and treatment of cancer can only be detected the cell and duct, density carcinogenic cells in compare with normal cells. The outputs of aforesaid algorithms are depicted in the figure1 to figure 6 for cancerous cells within the biopsy slide and the histogram of the images. of the proposed method is to remove the huge amount of fat, connective tissue and gland tissue from the cancerous cells within the histopathological biopsy samples. The stage, intensity, type, future of the proposed method is to remove the huge amount of fat, connective tissue and gland tissue from the cancerous cells within the histopathological biopsy samples. The stage, intensity, type, future development and treatment of cancer can only be detected on the basis of orientation of malignant cell, shape of the cell and duct, density carcinogenic cells in compare with normal cells. The outputs of aforesaid algorithms are depicted in the figure1 to figure 6 for cancerous cells within the biopsy slide and on the basis of orientation of malignant cell, shape of the cell and duct, density carcinogenic cells in compare with normal cells. The outputs of aforesaid algorithms normal slide along with Figure 1 The Original Histopathological Slide showing Malignant Cells along with Figure 1 The Original Histopathological Slide showing Malignant Cells along with Figure 1 The Original Histopathological Slide showing Malignant Cells along with Histogram @ IJTSRD | Available Online @ www.ijtsrd.com www.ijtsrd.com | Volume – 2 | Issue – 6 | Sep-Oct 2018 Oct 2018 Page: 859
International Journal of Trend in Scientific Research and Development (IJTSRD) ISSN: 2456 International Journal of Trend in Scientific Research and Development (IJTSRD) ISSN: 2456 International Journal of Trend in Scientific Research and Development (IJTSRD) ISSN: 2456-6470 Figure 2 The Grey Shade Histopathological Slide showing Malignant Cells along with Figure 2 The Grey Shade Histopathological Slide showing Malignant Cells along with Figure 2 The Grey Shade Histopathological Slide showing Malignant Cells along with Histogram Figure 3 Inverse ColourPolarisedHistopathological Slide showing EnhancedMalignant Portion along with Inverse ColourPolarisedHistopathological Slide showing EnhancedMalignant Portion along with Histogram Inverse ColourPolarisedHistopathological Slide showing EnhancedMalignant Portion along with Figure 4 The Original Histopathological Slide showing Normal Cells along with Figure 4 The Original Histopathological Slide showing Normal Cells along with Figure 4 The Original Histopathological Slide showing Normal Cells along with Histogram Figure 5 The Grey Shade Histopathological Slide showing N Figure 5 The Grey Shade Histopathological Slide showing Normal Cells along with ormal Cells along with Histogram @ IJTSRD | Available Online @ www.ijtsrd.com www.ijtsrd.com | Volume – 2 | Issue – 6 | Sep-Oct 2018 Oct 2018 Page: 860
International Journal of Trend in Scientific Research and Development (IJTSRD) ISSN: 2456 International Journal of Trend in Scientific Research and Development (IJTSRD) ISSN: 2456 International Journal of Trend in Scientific Research and Development (IJTSRD) ISSN: 2456-6470 Figure6. Inverse Color Polarized Histopathological Slide showing No 6. Inverse Color Polarized Histopathological Slide showing No abnormalities along with Histogram abnormalities along with Histogram Figure 1, 2 and 3 show the Cancerous tissue. In final Figure 3 all the fat, connective tissue and gland tissue are suppressed. It is only showing the parts, which are important to determine the carcinoma. It is depicting the abnormal orientation of malignant cell, shape of the cell and duct. In contrast, Figure 4, 5 and 6, show the normal slide and all the fat, connective tissue, and gland tissues are suppressed in Figure 6. The orientation, shapes etc. in this figure are normal in nature and showing no sign of carcinoma or abnormalities. The image histograms are colour clustering on the basis of algorithms. The primary objective is to suppress less or insignificant parts from the considerable portion of the slide image which is done by the contrast enhancement. prominence and clustering the similar ti colour polarization is done. The polarization of colour is highly proved by the aforesaid histograms provided. Conclusions In this paper, it is tried to amalgamate screening technology along with histopathological slide image analysis to make it a complete diagnosis tool to assist the experts. The histopathological slide analysis is described in this chapter is a simple and pr processing step by applying well established methods. References 1.Belhomme et al, “Towards a computer aided diagnosis system dedicated to virtual microscopy based on stereo logy sampling and diffusion maps”, Diagnostic Pathology, Vol. 6, Issue pp. 1-4, 2011. 2.Campanini et al, “A novel featureless approach to mass detection in digital mammograms based on Support Vector Machines”, Physics in medicine and Biology, Vol. 49, Issue-6, pp. 961 3.Chengetal, Classification Mammograms: A Survey”, Pattern Recognition, Vol. 36, Issue-12, pp. 2967 4.Etehad Tavakol et al, “Application of K Fuzzy c-Means for Color Segmentation of Thermal Infrared Breast Images”, Springer Journal of Medical Systems, Vol.34, pp.35 2010. 5.Hartigan et al, “A k-means clustering algorithm”, Journal of Applied Statistics, Vol. 28, pp. 100 108,1979. 6.Fung et al, "Mammographic Determination of Breast Volume by Elliptical Cone Estimation", World Journal of Surger pp.1442–1445, 2010. 7.Jiang et al, “Automated Detection of Breast Mass Spiculation Levels and Evaluation of Scheme Performance”, Academic Radiology, Vol. 15, Issue-12, pp. 5341-1544, 2008. 8.Li Liu et al, "Breast density classification usi histogram moments of multiple resolution mammograms", Biomedical Engineering and Informatics (BMEI), 3rd International Conference, pp. 146 – 149, 2010. 9.Belhomme et al, “Towards a computer aided diagnosis system dedicated to virtual microscopy based on stereo logy sampling and diffusion maps”, Diagnostic Pathology, Vol. 6, Issue pp. 1-4, 2011. 10.Bahlmann et al, "Automated Detection of Diagnostically Relevant Regions in H&E Stained Digital Pathology Slides", Proceedings SPIE 8315 Medical Imaging2012, Com Diagnosis, 23 Feb, 2012. Figure 1, 2 and 3 show the Cancerous tissue. In final connective tissue and gland tissue are suppressed. It is only showing the parts, which are important to determine the carcinoma. It is depicting “Computer-aided of aided Detection and in Micro Micro-calcifications Mammograms: A Survey”, Pattern Recognition, 12, pp. 2967-2991, 2003. malignant cell, shape of 4, 5 and 6, show Tavakol et al, “Application of K- and Means for Color Segmentation of Thermal Infrared Breast Images”, Springer – al Systems, Vol.34, pp.35–42, normal slide and all the fat, connective tissue, and gland tissues are suppressed in Figure 6. The orientation, shapes etc. in this figure are normal in of carcinoma or means clustering algorithm”, abnormalities. The image histograms are showing the the basis of algorithms. The primary objective is to suppress less or insignificant the considerable portion of the slide image which is done by the contrast enhancement. For prominence and clustering the similar tissue cells colour polarization is done. The polarization of colour is highly proved by the aforesaid histograms provided. Journal of Applied Statistics, Vol. 28, pp. 100- Fung et al, "Mammographic Determination of Breast Volume by Elliptical Cone Estimation", World Journal of Surgery, Vol. 34, Issue-7, Jiang et al, “Automated Detection of Breast Mass Spiculation Levels and Evaluation of Scheme Performance”, Academic Radiology, Vol. 15, 1544, 2008. In this paper, it is tried to amalgamate screening technology along with histopathological slide image analysis to make it a complete diagnosis tool to assist the experts. The histopathological slide analysis is described in this chapter is a simple and pre- processing step by applying well established methods. Li Liu et al, "Breast density classification using histogram moments of multiple resolution mammograms", Biomedical Engineering and Informatics (BMEI), 3rd International Conference, Belhomme et al, “Towards a computer aided diagnosis system dedicated to virtual microscopy logy sampling and diffusion maps”, Diagnostic Pathology, Vol. 6, Issue-S3, Belhomme et al, “Towards a computer aided diagnosis system dedicated to virtual microscopy sampling and diffusion maps”, Diagnostic Pathology, Vol. 6, Issue-S3, Bahlmann et al, "Automated Detection of Campanini et al, “A novel featureless approach to mass detection in digital mammograms based on Support Vector Machines”, Physics in medicine Regions in H&E Stained Digital Pathology Slides", Proceedings SPIE 8315 Medical Imaging2012, Computer-Aided 6, pp. 961-975,2004. @ IJTSRD | Available Online @ www.ijtsrd.com www.ijtsrd.com | Volume – 2 | Issue – 6 | Sep-Oct 2018 Oct 2018 Page: 861