Download
1 / 4
40 likes | 48 Views
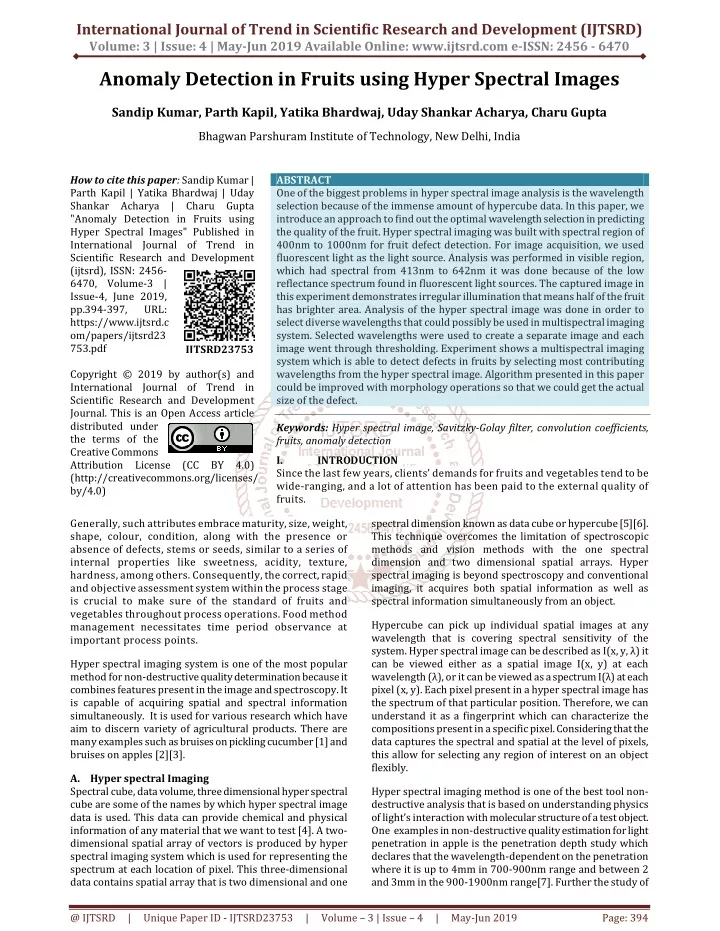
One of the biggest problems in hyper spectral image analysis is the wavelength selection because of the immense amount of hypercube data. In this paper, we introduce an approach to find out the optimal wavelength selection in predicting the quality of the fruit. Hyper spectral imaging was built with spectral region of 400nm to 1000nm for fruit defect detection. For image acquisition, we used fluorescent light as the light source. Analysis was performed in visible region, which had spectral from 413nm to 642nm it was done because of the low reflectance spectrum found in fluorescent light sources. The captured image in this experiment demonstrates irregular illumination that means half of the fruit has brighter area. Analysis of the hyper spectral image was done in order to select diverse wavelengths that could possibly be used in multispectral imaging system. Selected wavelengths were used to create a separate image and each image went through thresholding. Experiment shows a multispectral imaging system which is able to detect defects in fruits by selecting most contributing wavelengths from the hyper spectral image. Algorithm presented in this paper could be improved with morphology operations so that we could get the actual size of the defect. Sandip Kumar | Parth Kapil | Yatika Bhardwaj | Uday Shankar Acharya | Charu Gupta "Anomaly Detection in Fruits using Hyper Spectral Images" Published in International Journal of Trend in Scientific Research and Development (ijtsrd), ISSN: 2456-6470, Volume-3 | Issue-4 , June 2019, URL: https://www.ijtsrd.com/papers/ijtsrd23753.pdf Paper URL: https://www.ijtsrd.com/computer-science/artificial-intelligence/23753/anomaly-detection-in-fruits-using-hyper-spectral-images/sandip-kumar<br>

E N D
International Journal of Trend in Scientific Research and Development (IJTSRD) Volume: 3 | Issue: 4 | May-Jun 2019 Available Online: www.ijtsrd.com e-ISSN: 2456 - 6470 Anomaly Detection in Fruits using Hyper Spectral Images Sandip Kumar, Parth Kapil, Yatika Bhardwaj, Uday Shankar Acharya, Charu Gupta Bhagwan Parshuram Institute of Technology, New Delhi, India How to cite this paper: Sandip Kumar | Parth Kapil | Yatika Bhardwaj | Uday Shankar Acharya | Charu Gupta "Anomaly Detection in Fruits using Hyper Spectral Images" Published in International Journal of Trend in Scientific Research and Development (ijtsrd), ISSN: 2456- 6470, Volume-3 | Issue-4, June 2019, pp.394-397, URL: https://www.ijtsrd.c om/papers/ijtsrd23 753.pdf Copyright © 2019 by author(s) and International Journal of Trend in Scientific Research and Development Journal. This is an Open Access article distributed under the terms of the Creative Commons Attribution License (CC BY 4.0) (http://creativecommons.org/licenses/ by/4.0) Generally, such attributes embrace maturity, size, weight, shape, colour, condition, along with the presence or absence of defects, stems or seeds, similar to a series of internal properties like sweetness, acidity, texture, hardness, among others. Consequently, the correct, rapid and objective assessment system within the process stage is crucial to make sure of the standard of fruits and vegetables throughout process operations. Food method management necessitates time period observance at important process points. ABSTRACT One of the biggest problems in hyper spectral image analysis is the wavelength selection because of the immense amount of hypercube data. In this paper, we introduce an approach to find out the optimal wavelength selection in predicting the quality of the fruit. Hyper spectral imaging was built with spectral region of 400nm to 1000nm for fruit defect detection. For image acquisition, we used fluorescent light as the light source. Analysis was performed in visible region, which had spectral from 413nm to 642nm it was done because of the low reflectance spectrum found in fluorescent light sources. The captured image in this experiment demonstrates irregular illumination that means half of the fruit has brighter area. Analysis of the hyper spectral image was done in order to select diverse wavelengths that could possibly be used in multispectral imaging system. Selected wavelengths were used to create a separate image and each image went through thresholding. Experiment shows a multispectral imaging system which is able to detect defects in fruits by selecting most contributing wavelengths from the hyper spectral image. Algorithm presented in this paper could be improved with morphology operations so that we could get the actual size of the defect. Keywords: Hyper spectral image, Savitzky-Golay filter, convolution coefficients, fruits, anomaly detection I. Since the last few years, clients’ demands for fruits and vegetables tend to be wide-ranging, and a lot of attention has been paid to the external quality of fruits. spectral dimension known as data cube or hypercube [5][6]. This technique overcomes the limitation of spectroscopic methods and vision methods with the one spectral dimension and two dimensional spatial arrays. Hyper spectral imaging is beyond spectroscopy and conventional imaging, it acquires both spatial information as well as spectral information simultaneously from an object. IJTSRD23753 INTRODUCTION Hypercube can pick up individual spatial images at any wavelength that is covering spectral sensitivity of the system. Hyper spectral image can be described as I(x, y, λ) it can be viewed either as a spatial image I(x, y) at each wavelength (λ), or it can be viewed as a spectrum I(λ) at each pixel (x, y). Each pixel present in a hyper spectral image has the spectrum of that particular position. Therefore, we can understand it as a fingerprint which can characterize the compositions present in a specific pixel. Considering that the data captures the spectral and spatial at the level of pixels, this allow for selecting any region of interest on an object flexibly. Hyper spectral imaging system is one of the most popular method for non-destructive quality determination because it combines features present in the image and spectroscopy. It is capable of acquiring spatial and spectral information simultaneously. It is used for various research which have aim to discern variety of agricultural products. There are many examples such as bruises on pickling cucumber [1] and bruises on apples [2][3]. A.Hyper spectral Imaging Spectral cube, data volume, three dimensional hyper spectral cube are some of the names by which hyper spectral image data is used. This data can provide chemical and physical information of any material that we want to test [4]. A two- dimensional spatial array of vectors is produced by hyper spectral imaging system which is used for representing the spectrum at each location of pixel. This three-dimensional data contains spatial array that is two dimensional and one Hyper spectral imaging method is one of the best tool non- destructive analysis that is based on understanding physics of light’s interaction with molecular structure of a test object. One examples in non-destructive quality estimation for light penetration in apple is the penetration depth study which declares that the wavelength-dependent on the penetration where it is up to 4mm in 700-900nm range and between 2 and 3mm in the 900-1900nm range[7]. Further the study of @ IJTSRD | Unique Paper ID - IJTSRD23753 | Volume – 3 | Issue – 4 | May-Jun 2019 Page: 394
International Journal of Trend in Scientific Research and Development (IJTSRD) @ www.ijtsrd.com eISSN: 2456-6470 spectral, there are many researches that evaluate on several non-destructive methods which is based on multispectral imaging or the hyper spectral imaging for various applications. dimensional layers (called spectral bands) get converted into one-dimension using Principal Component Analysis, a statistical procedure which transformation to convert a set of observations of possibly correlated variables. After this whole process we get a two- dimensional array of hypercube in orthogonal form. ?In this step we find two most distinctive bands among all those bands which are present in the array. After reading the hypercube of the image, we get a two- dimensional array which contains all the feature bands in its each row.For finding these two bands, a band is selected at random and with the help of that band the most distinctive bands are find. Now projection is calculated between randomly selected band with each and every band present in the orthogonal subspace. This results a single band which have the maximum projection, this band is one of the most distinctive band. Now with the help of this band second distinct band is find, for second band the above process is repeated again with just replacing randomly selected band with the resulting distinct band. ?Savitzky-Golay filter is used to reduce remove distortion. After selecting two most distinct bands, Savitzky-Golay is a digital filter that can be applied to a set of digital data points for the purpose of smoothing the data, that is, to increase the signal-to-noise ratio without greatly distorting the signal. This is achieved, in a process known as convolution, by fitting successive sub-sets of adjacent data points with a low- degree polynomial by the method of linear least square. When the data points are equally spaced, an analytical solution to the least-squares equations can be found, in the form of a single set of "convolution coefficients" that can be applied to all data sub-sets, to give estimates of the smoothed signal at the central point of each sub-set. uses an orthogonal The spectral imaging is widely utilized in satellite imaging, where it is used to differentiate between different buildings, roads and vegetable farms and other geographical information. Further it is also used for to identify many objects like road or vehicles in territorial field [8]. The spectral imaging has huge applications in chemical field, medical field as well as quality inspection of agriculture on an early stage such as apples [3] also in citrus black spot detection [9]. There are many advantages of spectral imaging which include non-destructive nature, minimal sample preparation and visualizing spatial distribution of numerous chemical compositions simultaneously. This paper is organized as follows: In section II, the literature survey conducted on the paper has been mentioned, section III exhibits the design and architecture of the system along with the proposed algorithm. Then moving on to the evaluation and analysis part of the paper, section IV presents the implementation of the algorithm. Finally, section V presents the conclusion and Sec VI gives details about the Future work. II. Related Work This section contains the literature survey conducted. Eager interest has been shown towards the literature review in order to suffice with necessary information related to hyper spectral imaging techniques as well as their implementations. Some of the most important assessments using hyper spectral imaging involve: Different classification models were used including PCA, ROI and RF model in order to detect bruises which might be present on the surface of apples and analyze their condition [1]. In order to detect the external defect which may be caused by insects, hyper spectral images are subjected to PC1 two-band ratio algorithms[2]. Visible and near-infrared hyper spectral imaging along with short wave infrared have been brought into use providing bruise detection at early stages [3]. The concentration of single maize kernels is detected using near-infrared hyper spectral imaging data and its feasibility verified. Genetic algorithms have been used to predict the effect on performance and compatibility of crops [4]. The non-destructive abilities of apples were measured using the intensity of penetration of light through apple skin in order to gather information about the apple tissues analyzing the quality assessment of apples[7]. Fungal disease like the citrus black spot was detected using correlation analysis and pattern recognition using NDVI band ratio method which detected the disease responsible for premature dropping of fruits from trees[8]. III. SYSTEM DESIGN AND ARCHITECTURE In this section the architecture of the proposed methodology is presented. ?Hyper spectral image is dimensionally reduced using PCA. A hypercube of an image contains a set of hundreds of narrow and contiguous spectral bands. In this step we are trying to convert this three-dimensional hypercube to the two-dimensional orthogonal array. Now these two- Figure1. Schematic of hyper spectral imaging system REQUIRED STEPS FOR FINDING OPTIMAL WAVELENGTH BANDS ?Reading Hypercube: hypercube converts to the two-dimensional orthogonal array and further into one-dimension. After the entire process, we get a two-dimensional array of hypercube in orthogonal form. ?Selection of two most distinctive bands: To find these two bands, a band is selected at random and with the help of that band the most distinctive bands are find. Now projection is calculated between randomly selected band with each and every band present in the orthogonal subspace. This results a single band which Here, three-dimensional @ IJTSRD | Unique Paper ID - IJTSRD23753 | Volume – 3 | Issue – 4 | May-Jun 2019 Page: 395
International Journal of Trend in Scientific Research and Development (IJTSRD) @ www.ijtsrd.com eISSN: 2456-6470 have the maximum projection, this band is one of the most distinctive band. With the help of this band second distinct band is found, for second band the above process is repeated again and again with just replacing randomly selected band until the second band gets recognised. ?Selection of optimal wavelength bands: Then, a filter is used named Savitzky-Golay filter for smoothing the data, that is, to increase the signal-to-noise ratio without greatly distorting the signal. Using convolution, the data points get equally spaced. [10] where J is the bands matrix of selected bands in the band list set and y is value of each band to which it will be compare to i.e. . Figure 3: Guava image built from default wavelengths. We can clearly see if there is any area with bruise on the fruit from Fig 2. Thereafter we perform comparison between the final image and the ideal fruit for calculating quality. The quality percentage for this fruit came out to be 96%. By comparing the image 2 and 3 we can confirm that this algorithm can detect any defects in a fruit at early stage. V. CONCLUSION This paper proposes the use of hyper spectral images in order to detect anomalies which may be present in fruits. To produce the results, the hyper spectral image is read by converting the given hypercube of image in the form of the two-dimensional array in orthogonal form. Then the algorithm tries to find the two most distinctive spectral bands. In this phase one band is selected at random and compared to every other band present, this process provides us a band which has the maximum dissimilarity. Euclidean distance is calculated between the two optimal wavelength band and comparison is done on the basis of the calculated Euclidean distance. The result outputs optimal wavelength bands which contain all the information about the defected part present in the given fruit and the final result is procured by the user and the percentage of defect calculated using ideal images. VI. Future Work The current system analyses hyper spectral images in order to detect any anomalies present and analyses the percentage of defect, if any, from an ideal image of the fruit. Future endeavours on the project intend to reduce the size of hyper spectral images and also the time taken to load the images by the algorithm and to produce results. The produced system will help in assessing the price and percentage of defect found in fruits used in marriages which are discarded even if a little deformed. These fruits could have been used by economically weaker people for lesser price if defect gets detected. With quality separated fruits this wastage can be avoided and hence the economically weaker population can buy such fruits for lower prices and fulfil their dietary needs. VII. ACKNOWLEDGEMENT We thank Assistant prof. Charu Gupta for assistance and Palak Girdhar, Assistant professor, BPIT for comments that greatly improved the manuscript. We also thank the college authority for providing us with the opportunity to work on the subject and explore our abilities. [10] Where P0,….,Pk is a set of mutually orthogonal vector (bands). The value ‘a’ in (1) is compared with minimum value obtained in the band list so far to calculate the next band. And the new value of the minimum is overwritten with the new value calculated. ALGORITHM 1.Start 2.Capture Hyper spectral Image. 3.Remove noise in image using Savitzky-Golay filter. 4.Select most contributing wavelengths from the image. 5.Display individual image from different wavelengths. 6.Thresholding 7.Comparison of the final image for calculating quality of the fruit. 8.End IV. Analysis In this section the system is analysed and evaluated producing the result. After performing the algorithm we proposed on the hyperspectral images of fruits we get the following image as output which has the most distinctive bands Figure2: Final image showing the defected areas @ IJTSRD | Unique Paper ID - IJTSRD23753 | Volume – 3 | Issue – 4 | May-Jun 2019 Page: 396
International Journal of Trend in Scientific Research and Development (IJTSRD) @ www.ijtsrd.com eISSN: 2456-6470 [6]Y. R. Chen, K. Chao, and M. S. Kim, “Machine vision technology for agricultural applications,” Computers and Electronics in Agriculture, vol. 36(2), pp. 173-191, 2002. [7]J. Lammertyn, A. Peirs, J. De Baerdemaeker, and B. Nicolai, “Light penetration properties of NIR radiation in fruit with respect to nondestructive quality assessment,” Postharvest Biology and Technology, vol. 18(2), pp. 121–132, 2000. [8]M. Prashnani and R. S. Chekuri, “Identification Of Military Vehicles In Hyper Spectral Imagery Through Spatio-Spectral Filtering,” Proceedings of IEEE Second International Conference on Image Information Processing, pp. 527`–532, 2013. [9]D. M. Bulanon, T. F. Burks, D. G. Kim, and M. A. Ritenour, “Citrus black spot detection using hyper spectral image analysis,” Agricultural Engineering International: CIGR Journal, vol. 15(3), pp. 171-180, 2013. [10]Whittaker, E. T; Robinson, G (1924). The Calculus Of Observations. Blackie & Son. pp. 291–6. OCLC 1187948.. "Graduation Formulae obtained by fitting a Polynomial." References [1]D. P. Ariana, R. Lu, and D. E. Guyer, “Near-infrared hyper spectral reflectance imaging for detection of bruises on pickling cucumbers,” Computers and Electronics in Agriculture, vol. 53(1), pp. 60-70, 2006. [2]J. Xing, C. Bravo, P. T. Jancsok, H. Ramon, and J. D. Baerdemaeker, “Detecting Bruises on ‘Golden Delicious’ Apples using Hyper spectral Imaging with Multiple Wavebands,” Biosystems Engineering, vol. 90(1), pp. 27-36, 2005. [3]G. ElMasry, N. Wang, C. Vigneault, J. Qiao, and A. ElSayed, “Early detection of apple bruises on different background colors using hyper spectral imaging,” LWT, vol. 41(2), pp. 337-345, 2008. [4]R. P. Cogdill, C. R. Hurburgh Jr., and G. R. Rippke, “Single-kernel maize analysis by near-infrared hyper spectral imagin,”. Transactions of the ASAE, vol. 47(1), pp. 311-320, 2004. [5]K. Chao, Y. R. Chen, W. R. Hruschka, and B. Park, “Chicken heart disease characterization by multi- spectral imaging,” Applied Engineering in Agriculture, vol. 17, pp. 99-106, 2001. @ IJTSRD | Unique Paper ID - IJTSRD23753 | Volume – 3 | Issue – 4 | May-Jun 2019 Page: 397