Download
1 / 15
150 likes | 228 Views
A Traffic Chaos Reduction Approach for Emergency Scenarios. NetCri’07 The First International Workshop on Research Challenges in Next Generation Networks for First Responders and Critical Infrastructures April 13th, 2007.

E N D
A Traffic Chaos Reduction Approach for Emergency Scenarios NetCri’07 The First International Workshop on Research Challenges in Next Generation Networks for First Responders and Critical Infrastructures April 13th, 2007 Syed R. Rizvi†, Stephan Olariu†, Mona E. Rizvi‡, and Michele C. Weigle† †Department of Computer Science, Old Dominion University, Norfolk, VA ‡ Department of Computer Science, Norfolk State University, Norfolk, VA
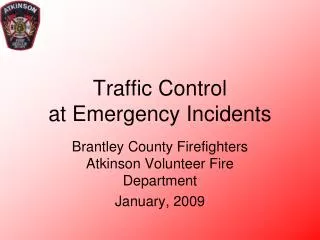
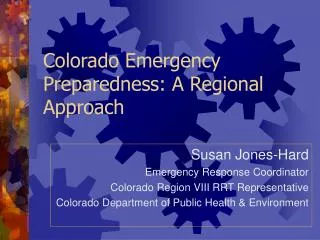
Problems Addressed • Traffic chaos caused by presence of emergency vehicles • sirens • increased accidents for emergency personnel • Traffic chaos caused by large-scale evacuations • resource availability • contraflow
Our Approach • Efficient chaos-reducing information dissemination approach • targeted towards first responders and evacuations • using a vehicular ad-hoc network (VANET) • Provide emergency vehicle path-clearing technique • Provide real-time resource availability information
Assumptions • All vehicles act as information servers relaying information for the VANET. • No location servers or access points on the roadside. • Every vehicle has a navigation system, which plans its route and knows its current location.
Building Blocks • Resources: emergency service vehicles (ESVs), gas stations, hospitals, shelters, etc. • Reports: information sent by resources • Dissemination: wireless broadcast • Selection strategies: based on spatial relevance
ESV Route Traffic Chaos Reduction Approach The ESV periodically broadcasts a report containing: • unique ID of ESV • type of ESV • start and end points • route code • tentative average speed of ESV along route • current ESV location and time • timestamp of report sent by the ESV
Clearing Time Computation • Each vehicle in the path computes the time to intersection with the ESV based on the average ESV speed, ESV location, and current time • Driver should give way to ESV between 30-60 seconds before intersection time
Report Selection Strategy • The relevance of a resource report is calculated through a relevance function • time report was sent • distance from the ESV • speed of the ESV • Periodically, reports in a vehicle’s database are sorted according to relevance • Most relevant report is used for computing clearing time and is broadcast to neighbors
ESV Route Code {(sx,sy)/cnt, (px,py)/O, (rx,ry)/15, (dx,dy)} Start {sx,sy} Street Code: M Street Code: N Connecticut Ave, Point P {px,py} Point R {rx,ry} Street Code: O Street Code: cnt Street Code: P End {dx,dy} Street Code: 12 Street Code: 13 Street Code: 14 Street Code: 15
Evacuation Traffic Chaos Reduction Approach • Resources (gas stations, shelters, hospitals) periodically broadcast reports • type of resource • availability of resource • location • timestamp of report • Reports updated as availability changes • Information filtered for relevance according to vehicle’s location
ESV Simulation Model • Written in • use of multiple threads for traffic generation, automobiles and ESVs. • Mobility model • nodes move in piecewise linear fashion, following city streets.
Simulation Results • Data success rate • ratio of number of vehicles on ESV route that receive the message in time to clear the path to the total number of vehicles on the ESV route • As expected, increasing the density of vehicles, improves the success rate Data Success Rate Vehicular Density (vehicles/km2)
Conclusion • Traffic Chaos Reduction Approach for Emergency Scenarios • emergency service vehicle path-clearing • evacuation resource availability • Future Work • improve simulation/mobility model • investigate bandwidth usage • investigate security issues
Department of Computer Science Old Dominion University Norfolk, Virginia VANET Research Group http://www.cs.odu.edu/~vanet Department of Computer Science Norfolk State University Norfolk, Virginia