Download
1 / 38
380 likes | 489 Views
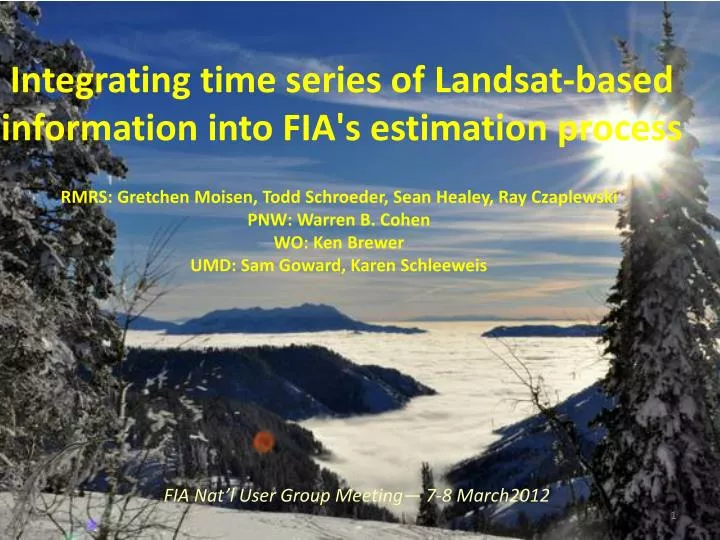
Integrating time series of Landsat -based information into FIA's estimation process. RMRS: Gretchen Moisen, Todd Schroeder, Sean Healey, Ray Czaplewski PNW: Warren B. Cohen WO: Ken Brewer UMD: Sam Goward, Karen Schleeweis. FIA Nat’l User Group Meeting— 7-8 March2012. Some Simple Questions.

E N D
Integrating time series of Landsat-based information into FIA's estimation process RMRS: Gretchen Moisen, Todd Schroeder, Sean Healey, Ray Czaplewski PNW: Warren B. Cohen WO: Ken Brewer UMD: Sam Goward, Karen Schleeweis FIA Nat’l User Group Meeting— 7-8 March2012
Some Simple Questions Status: How much is out there now, ….and where is it? Change: What just happened?Trend: What’s happening?
Status: Change: Trend: How’s FIA Doing? A- I A …for effort I …for accomplishment
Outline 1. Forest disturbance and monitoring 2. History of the North American Forest Dynamics (NAFD) Project 3. NAFD Phase 3 4. How can we integrate Landsat time series into FIA’s estimation processes?
Forest Disturbance • Impacts ~ 1-3% of a forest area per year • Occurs at different spatial scales, temporal scales, and intensities • Can impact canopy, understory and forest floor • Climate change and growing human population may alter the frequency and severity of future disturbance regimes • Monitoring has taken on renewed importance Clearcut Fire Spatial Temporal
Disturbance and Time (Brewer, 2009)
Disturbance and Space (Brewer, 2009)
Monitoring Through Plots Unbiased estimates at broad scales Sampling error is well understood Measurement error can be assumed to be negligible for many variables Results are not spatially explicit at the local level Revisit frequency may miss disturbance events Post-dating is problematic Difficult to see upper canopy disturbances from the ground
Monitoring Through Landsat Time Series 16-day repeat cycle and 40-year historical archive allows development of dense image times series which can be used to detect changes in forest cover over large areas. Spatial grain (30m) and variety of spectral bands allows detection and causal attribution of most natural and anthropogenic disturbances. Can be used for mapping forest change and for collecting human interpreted reference data (e.g. Timesync). There is no sampling errorBUT measurement error is variable and often poorly understood.
Different monitoring methods are appropriate for different purposesJoining traditional forest inventory data with temporally dense satellite data results in new information for monitoring change and trend
Outline 1. Forest disturbance and monitoring 2. History of the North American Forest Dynamics (NAFD) Project 3. NAFD Phase 3 4. How can we integrate Landsat time series into FIA’s estimation processes?
North American Forest Dynamics (NAFD) (UMD, NASA-Goddard, FIA, PNW, NRS, CFS, CONAFOR)
North American Forest Dynamics NASA-funded project designed to characterize disturbance patterns and recovery rates of forests across the continent Goal: Determine the role of forest dynamics in North American carbon balance
Phase I & II Sample Sites Processed time series (1985-2008) of Landsat satellite imagery using FIA inventory data for validation and training Eastern Stratum Phase I Phase II Western Stratum Phase I Phase II
Vegetation Change Tracker (Huang et al. 2006, 2008) Lake Anna, VA, 60 km NW of Richmond, VA
NAFD “Science” (NASA, PNW, UMD, CONAFOR, CFS, and others) Characterizing disturbance and regrowth patterns on US forests by analyzing a biennial time series of Landsat imagery over a sample of Landsat data cubes spread across US forests. Objectives include: Produce nationwide estimates of forest dynamics for NACP Convert data cube reflectance to data cube biomass Develop nationwide maps predictions of forest dynamics Begin trials in Canada and Mexico Quantify forest component of woody encroachment nationally
NAFD “Applications” (NASA, PNW, UMD, all FIA units) Illustrate how FIA data can be combined with temporal disturbance and biomass products to answer management questions relevant to FIA users. • Developed FIA monitoring products that take advantage of satellite-derived disturbance and biomass data (storm-related loss, harvest rates across time and ownerships, fragmentation, carbon considerations) • Note studies by Sean Healey, Mark Nelson, Randy Morin, Hobie Perry, Andy Lister, John Coulston, and others
Detour: A Model for Collaboration • Pre-proposal communication with FIA • Engagement of FIA scientists and managers • Common problem identification • Memorandum of Understanding • Sensitivity to logistical and political constraints • Patience
Outline 1. Forest disturbance and monitoring 2. History of the North American Forest Dynamics (NAFD) Project 3. NAFD Phase 3 4. How can we integrate Landsat time series into FIA’s estimation processes?
NAFD Phase 3(Goward, Huang,Cohen, Masek, Moisen, Nemani) 1) Conduct an annual, wall-to-wall analysis of US disturbance history between1985-2010 2) Undertake a detailed validation of the resultant national disturbance map 3) Examine variation in post-disturbance forest recovery trajectories, using repeat measurements from FIA plot data, 4) Determine disturbance causal agents ***
Cause of Disturbance Maps Disturbance Year Disturbance Type
Database of Forest Change Processes (Scleeweis et al., In Review) Web Browser/Distribution GeoDatabase Forest Change Processes User Community
Incorporating Textural Metrics • Different disturbance processes result in different patterns of landscape structure and fragmentation that are visible in Landsat Imagery. 1984 1987 Harvest Fire Suburbanization Patch level spatial metrics Continuous Discrete • Shape • Direction • Fractal dimension • Area • Compactness • Homogeneity • Edge Contrast • Heterogeneity • Texture • Range/Mean
Spectral-Temporal Patterns of Disturbance Structure Green Leaf Area (Schroeder et. al, 2010)
Pilot Phase for Attributing Cause of Disturbance Ten sample scenes were identified as good candidates for testing, representing a range of causal agents and varying forest types and prevalence.
Outline 1. Forest disturbance and monitoring 2. History of the North American Forest Dynamics (NAFD) Project 3. NAFD Phase 3 4. How can we integrate Landsat time series into FIA’s estimation processes?
Post-stratification Disturbance Year Disturbance Type
Alternatives to the Moving Average (Czaplewski, 2008)
Endogenous Post-stratification(Breidt and Opsomer 2008; Dahlke et. al In Press, Tipton et. Al In Prep) Using FIA as training data to make maps Then using those maps to post-stratification that same FIA data
Strategic Timing of Ground Observation Before After AREBA: Accelerated Remeasurement and Evaluation of Burned Areas (RSAC 2009)
LandTrendr (Kennedy et al.) TimeSync (Cohen et al.) Trend Anomaly 2002 1994 2000
Plot History: Clearcut and recovery Andy Gray
Plot History: Defoliation, delayed mortality, recovery, salvage, and recovery Andy Gray
A Utah Example: Comparing FIA and Timesync Observations of Disturbance Very few disturbances are detected by both Timesync and FIA. FIA records lots of disturbances which are undetectable by Landsat (e.g. animal damage). Disturbance is less common thus overall accuracy is inflated by high proportion of undisturbed plots. 82% of disturbances detected only by Timesync fall outside FIA’s observation window (i.e. disturbance date is > 5 yrs before or is after plot measurement date). (Schroeder et. al, In Prep.)
Integrating Landsat time series into FIA’s estimation processes?
Integrating Landsat time series into FIA’s estimation processes? Make best use of (endogenous) post-stratification Incorporate Landsat (photo)-based “observations” on field plots Consider alternative sampling frequency for disturbed strata Develop alternatives to the MA and make best use of RS data through model-assisted or model-based methods Ensure compatibility between status maps and status estimates Ensure compatibility in maps through time Explore ways to reduce costs through these processes
Third phase of NAFD is providing annual maps of forest disturbance along with attribution, validation, and re-growth analyses nationwideWe need to keep pushing our statistical tools beyond post-stratification and moving average into more integrated ground and RS approaches FIA Nat’l User Group Meeting— 7-8 March2012