Download
1 / 27
270 likes | 274 Views
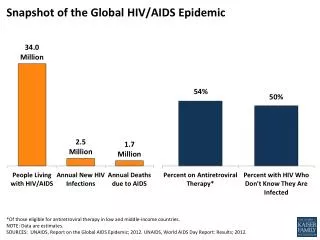
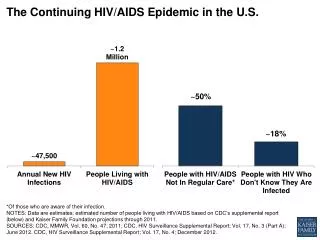
The HIV/AIDS Epidemic in the United States. Jennifer Kates, M.A., M.P.A. Vice President and Director, HIV Policy Kaiser Family Foundation KaiserEDU.org Tutorial February 2006. Figure 1. The U.S. Epidemic: Snapshot of Key Data. Note: Data are estimates.

E N D
The HIV/AIDS Epidemic in the United States Jennifer Kates, M.A., M.P.A. Vice President and Director, HIV Policy Kaiser Family Foundation KaiserEDU.org Tutorial February 2006
Figure 1 The U.S. Epidemic: Snapshot of Key Data Note: Data are estimates. Sources: CDC, 2005; Glynn, K. et al., CDC, "Estimated HIV prevalence in the United States at the end of 2003", Presentation at the National HIV Prevention Conference, 2005; Fleming, P., et al., “HIV Prevalence in the United States 2000”, 9th Conference on Retroviruses and Opportunistic Infections, 2002.
Figure 2 New AIDS Cases, Deaths, and People Living with AIDS, 1985-2004 People Living with AIDS New AIDS Cases People Living with AIDS Deaths and New AIDS Diagnoses Deaths among People with AIDS 2004 Note: Data are estimates. Source: CDC, Data Request, 2006.
Figure 3 Proportion of AIDS Cases, by Race/Ethnicity, 1985-2004 Percent of AIDS Diagnoses White, non-Hispanic African American Latino American Indian/ Alaska Native Asian/Pacific Islander 2004 Note: Data are estimates. Source: CDC, Data Request, 2006.
Figure 4 AIDS Diagnoses and Population, by Race/Ethnicity, 2004 AIDS Cases U.S. Population 42,514 293,655,404 White, non-Hispanic 28% 69% African American 49% 13% Latino 14% 4% 20% Asian/Pacific Islander 1% 1% <1% AI/AN Notes: U.S. Population estimates do not include U.S. dependencies, possessions, and associated nations; persons who reported more than one race were included in multiple categories.May not total 100% due to rounding. Total AIDS diagnoses in 2004 include persons of unknown race or multiple races. AI/AN = American Indian/Alaskan NativeSources: CDC, HIV/AIDS Surveillance Report, Vol. 16, 2005; U.S. Census Bureau, Population Estimates Program, 2004 Population Estimates.
Figure 5 Women as a Share of New AIDS Diagnoses Note: Data are estimates. Sources: CDC, Data Request, 2006.
Figure 6 New AIDS Diagnoses by Race/Ethnicity and Sex, 2004 2% Other 1% Other 17% White 33% White 67% African American 44% African American 15% Latina 20% Latino Women N = 11,109 Men N = 30,203 Note: Data are estimates for adults/adolescents and do not include cases from the U.S. dependencies, possessions, and associated nations, and cases of unknown residence. Source: CDC, HIV/AIDS Surveillance Report, Vol. 16, 2005.
Figure 7 Reported HIV Cases Among Teen Girls and Younger Women, 2003 Notes: Data based on person’s age at diagnosis, from 41 areas with confidential name-based HIV surveillance for adults and adolescents in 2003. Source: CDC, HIV/AIDS Surveillance in Adolescents, L265 Slide Series Through 2003.
Figure 8 HIV Spread Primarily Through Sex, Increasingly Heterosexual Heterosexual 3% 13% Other 31% Heterosexual 19% IDU 65% MSM 42% MSM 6% Other 22% IDU 1985 2004 Notes: Data are estimates. May not total 100% due to rounding. Sources: CDC, Presentation by Dr. Harold Jaffe, “HIV/AIDS in America Today”, National HIV Prevention Conference, 2003; CDC, HIV/AIDS Surveillance Report, Vol. 16, 2005.
Regional, State, & Local Impact
Figure 9 AIDS Case Rate per 100,000 Population by Region, 2004 Notes: Case rates calculated by KFF; data do not include U.S. territories and possessions. Sources: CDC, HIV/AIDS Surveillance Report, Vol. 16, 2005; U.S. Census Bureau, Population Estimates Program, 2004 Population Estimates.
Figure 10 Top 10 States by AIDS Case Rate per 100,000 Population, 2004 U.S. Rate = 15.0 Source: CDC, HIV/AIDS Surveillance Report, Vol. 16, 2005.
Figure 11 Top 10 States by AIDS Case Rate per 100,000 African Americans, 2004 U.S. Rate = 73.9 Note: Data not available for U.S. dependencies, possessions, and independent nations in free association with the United States. Source: Kaiser Family Foundation, State Health Facts (CDC, Special Data Request, November 2005).
Figure 12 Top 10 States by AIDS Case Rate per 100,000 Among Women, 2004 U.S. Rate = 9.5 Source: Kaiser Family Foundation, State Health Facts (CDC, Special Data Request, November 2005).
Figure 13 Top 10 MSAs by AIDS Case Rate per 100,000 Population, 2004 U.S. Rate = 15.0 Note: MSAs with 500,000 or more population. Source: CDC, HIV/AIDS Surveillance Report, Vol. 16, 2005.
Federal Funding of Health Care and Prevention Services for HIV/AIDS
Figure 14 Federal Funding for HIV/AIDS by Category, FY 2005 US$ Billions Total: $19.7 billion *Not including international research which is counted in the research and prevention categories. Sources: Kaiser Family Foundation, Federal Funding for HIV/AIDS: The FY 2006 Budget Request, 2/05; DHHS, Office of Budget/ASBTF, 2/05; SSA, Office of the Actuary, 4/05; CMS, Office of the Actuary, 2/05; State Department, Office of the Global AIDS Coordinator; U.S. Congress, FY 2005 Consolidated Appropriations Bill and Conference Report.
Figure 15 Major Federal Sources of Funding for HIV/AIDS Care • Medicaid • Medicare • Ryan White CARE Act • Others include: Department of Veterans Affairs; SAMHSA; Community and Migrant Health Centers Sources: Kaiser Family Foundation, Financing HIV/AIDS Care: A Quilt with Many Holes, May 2004; DHHS, Office of Budget/ASBTF, 4/05.
Figure 16 Medicaid’s Role in HIV/AIDS Care Federal Medicaid Spending on HIV/AIDS Care as Percent of Federal Spending on HIV/AIDS Care FY 2005 • Provides health & long-term care coverage for more than 52 M low-income people • Largest source of coverage for people with HIV/AIDS • ≈250,000 Medicaid beneficiaries with HIV/AIDS • Reflects epidemic’s impact on low-income populations • Many with HIV/AIDS qualify through disability-related pathway • Mandatory and Optional Services • All states cover Rx drugs Medicaid 49% ($5.7B) All Other 51% ($6.0B) Medicare Total: $11.7 B Sources: Kaiser Family Foundation, Medicare and HIV/AIDS, 9/05; KCMU, The Medicaid Program at a Glance, 1/05. Medicaid HIV/AIDS spending estimate from CMS, Office of the Actuary, 2005, and HHS Office of the Budget, 2005.
Figure 17 Medicare’s Role in HIV/AIDS Care Medicare Spending on HIV/AIDS Care as Percent of Federal Spending on HIV/AIDS Care FY 2005 • Covers nearly 42 M seniors and persons with disabilities • Second largest source of HIV/AIDS coverage • ≈100,000 Medicare beneficiaries with HIV/AIDS, • Many have supplemental assistance, including Medicaid and ADAP to pay for drugs • New Medicare Part D Drug Coverage • Concerns about adequacy of formularies and transition of Dual Eligibles (ARVs yes, other Rx?) • Effect on ADAP? Medicaid Medicare 25% ($2.9B) All Other 75%($8.8B) Total: $11.7 B Sources: Kaiser Family Foundation, Medicare and HIV/AIDS, 9/05; Kaiser Family Foundation, Medicare at a Glance, 9/05. Medicare HIV/AIDS spending estimate from CMS, Office of the Actuary, 2005, and HHS Office of the Budget, 2005.
Figure 18 The Ryan White CARE Act • Original intent: relief to safety net (public hospitals) • Important safety-net for uninsured and low-income individuals • Discretionary program, not entitlement • Only disease-specific discretionary grant program for care for people with HIV/AIDS • Builds on Medicaid • Gap filler in terms of eligibility AND services • Services provided include: comprehensive primary care support services, medications • What you get depends on where you live • $2.1 B in FY 2005
Figure 19 Components of the CARE Act ADAP Clients, by Income Level, June 2004 • Title I: Eligible Metropolitan Areas (Cities) • Title II: Funding to States • Includes earmark for AIDS Drug Assistance Program (ADAP) • Title III: Funds early intervention services, capacity building, planning • Title IV: Funds Services for Women, Youth, Children, Infants • Other Funding for: AIDS Education and Training Centers, Dental Services, Special Projects of National Significance >300% FPL 5% Unknown 3% 201-300% FPL, 11% <100% FPL 51% 101-200% FPL 29% Sources: DHHS, HRSA, HIV/AIDS Bureau; KFF, NASTAD, National ADAP Monitoring Report, April, 2005.
Figure 20 HIV Prevention HIV Prevention Funding at CDC, FY 1995-2005 (US $ Millions) • Centers for Disease Control and Prevention (CDC) • Most prevention funding • Funds go to states; some cities; community based organizations; other entities/programs • Additional prevention funding also at: Department of Veterans Affairs, SAMHSA, and other agencies • National HIV prevention goal (reduce new infections by 50% by 2005) was not met $589.8 $616.8 All Other 51% ($6.0B) $656.6 Medicare $749.7 Ryan White $793.6 $731.7 Sources: CDC, Personal Communication, 2006; CDC, HIV Prevention Strategic Plan Through 2005.
Figure 21 CDC’s “Advancing HIV Prevention: New Strategies for A Changing Epidemic” • Announced in 2003 • Aims to: • reduce barriers to early diagnosis of HIV • increase access to quality medical care, treatment, and ongoing prevention services for with HIV. • Four Main Strategies • Incorporate HIV testing as a routine part of care in traditional medical settings • Implement new models for diagnosing HIV infections outside medical settings (e.g., rapid testing) • Prevent new infections by working with people diagnosed with HIV and their partners • Further decrease mother-to-child HIV transmission Sources: CDC, Advancing HIV prevention: New strategies for a changing epidemic. MMWR 2003;52:329-332; CDC, AHP: http://www.cdc.gov/hiv/prev_prog/AHP/default.htm.
Figure 22 Key Summary Points about the Domestic Epidemic • Approaching 25 years of AIDS • Tremendous successes in the U.S. including • significant reduction in new infections since the 1980s • antiretroviral treatment and people living longer • reduction in mother to child transmission • But the U.S. epidemic is not over - troubling signs, potential increases among some populations • Impact varies across country – complex & “local” • Minority Americans, particularly African Americans, women, young people, men who have sex with men • Many challenges remain for prevention, care, treatment, and research