Download
1 / 44
440 likes | 672 Views
29 th ICHCA. Current Status. &. Future Development of Busan Port. May 28, 2008. Contents. I . Current Status of Busan Port II . Merits of Busan Port III. Development Strategy. 2. 2 nd Largest City in Korea. World ’ s 5 th Largest Container Port. Global Production Base.

E N D
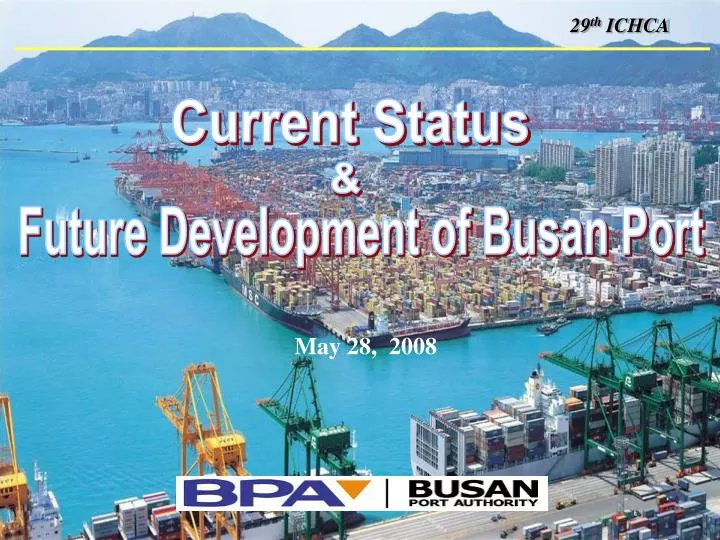
29th ICHCA Current Status & Future Development of Busan Port May 28, 2008
Contents I . Current Status of Busan Port II . Merits of Busan Port III. Development Strategy 2
2nd Largest City in Korea World’s 5th Largest Container Port Global Production Base City of Tourism & Convention Busan : World 5th Largest Port Busan : World’s 5th Largest Port 3
Busan : Center of Northeast Asia 3-hour Flight Radius 20%of World’s GDP Eastern Gateway to Russia 35%of World Container Volume 25%of World’s Population Logistics Hub 2nd Largest Economy Largest Manufacturing Base 4
Busan Port Passenger Terminal North Harbor Gamcheon Harbor South Harbor • Since 1876 • 5th Rank Container Port • 80% Container Volume in Korea Dadaepo Harbor Busan New Port 5
Busan North Port • Gamman & SinGamman Terminal 6
Passenger Terminal • International : 1.4 million passengers 2007 • Domestic : 1 million passengers 2007 7
Gamcheon Port • Major Port of General Cargo - Dry Bulk Cargo : Frozen Fish, Foodstuff 8
Busan New Port • Opened January 2006 • 1st Phase 6 berths in operation 9
Increasing share of throughput handled in NE Asia 680.9 M TEU Share of Container Volume in NE Asia 600 400.6 70% 400 2011 259.3 38% 200 200 140.1 85% 2005 100 NE Asia World NE Asia World 35% 2005 2011 Total Port Handling ※ Source :Drewry (2006) 10
Qingdao Tianjin Dalian 1336 1633 1322 Shanghai Super-hub Port Project Busan 28 52 3572 Ningbo 1624 Large Scale Port Expansion Plan in NE Asia ※ Source : Ports’ homepage 11
Volume Trend of Busan Port (Unit:’000 TEU.%) 13,000 TOTAL T / PUT Total T/Put T/S T / PUT 11,492 11,492 13,261 11,000 12,039 8,072 (10.2%) 7,540 11,843 9,000 11,492 10,407 5,178 7,000 T/S T/Put 4,792 9,453 4,251 5,811 3,887 5,000 5,209 (11.6%) 2,942 5,178 2,389 4,792 4,251 3,000 3,887 2005 2002 2003 2004 2006 2007 12
2007 World’s Port Ranking (Unit: ’000 TEU) 30,000 27,935 (12.7%) 26,150 (20.5%) < Ranking Change > . Shanghai : 3rd → 2nd . Hong Kong : 2nd → 3rd . Rotterdam : 7th → 6th . Kaohsiung : 6th → 8th 23,998 (2.0%) 21,091 (14.2%) 24,000 18,000 13,261 (10.2%) 10,790 (11.7%) 12,000 10,700 (20.0%) 10,257 (4.9%) 9,900 (11.7%) 6,000 Hong Kong Kaohsiung Hamburg Dubai Busan Shenzhen Rotterdam Singapore Shanghai ※ Source : Ports’s homepage ※ Dubai and Hamburg : Shipping Daily Estimate 13
Busan Port CNTR Trade Volume by Nations (Unit:’000 TEU.%) * Coastal included in total 15
Merits of Busan Port • Location • Connectivity • Stability • Cost 16
Strength of Busan Port Location Busan 17
Strength of Busan Port Connectivity ◈ Japan: 60 ports ◈ China: 30 ports ◈ Russia: 5 ports 8 18
Strength of Busan Port Stability □ Natural Safe Port □ Stable Labor Relations - No strike in port operation - Privatization of Port Worker (’07) 19
Strength of Busan Port Cost □ Competition in Port Service - 7 Terminal Operators □ Incentive Scheme - Shipping Line, Shipper, Terminal Operator □ Productivity - North Port + New Port 8 20
Development Strategy of Busan Port High Value-Added Versatile Port • Old Port Area Redevelopment U-Port • Distripark Development • New Port Construction Establishment of BPA 22
Busan North and New Port Future Current Current Port New Port Near Residential Area City Area Away from City CAPA : 6 M TEU vs ACT : 12 M TEU CAPA:6 M TEU Svc Upgrade CAPA : 15 M TEU Congestion in OPN Redevelopment of Old Port Area Distripark for Value-added Svc Waterfront occupied by Commercial Activity Versatile Port 23
25㎞ New Port Construction New Port Present Port 24
Aerial View of New Port 1st Phase : 6 berths 25
New Port Project 30 Container Berths by 2015 (Berth Length : 10Km) Water Depth 16 ~ 18 m Total Capacity of 15 million TEU Total 10 million㎡ Distripark 26
7 Construction Plan 30 (Berth) 27 18 6 3 2005 2006 2008 2009 2011 2015 27
Terminal Investment Status Phase 2-2 (’08) Phase 1 (’05~’08) Phase 2-3 (’09) Phase 2-1 (’08) Phase 2-4 (’11) Phase 2-5 (’15)
New Port Hinterland Road & Rail Rail Highway Namhae Highway Road Ⅱ Road Ⅰ Access Rail 30
3rd : 6.4M㎡ 2nd : 1.4M㎡ Distripark Development - Total 10M㎡, 3 Stages 1ST : 1.7 M ㎡ North Container Terminal West Container Terminal Sorth Container Terminal 31
Packaging Storage Target Business • Applicable Business • Cargo Handling • Transportation • Storage • Exhibition • Multi-Logistics • Int'l Logistics Assembling, Sorting Stevedoring 32
Incentives in Distripark Busan New Port • Lease Terms and Conditions - Lease Period : Max 50 Years - Lease Fee : 49 cents / ㎡ / Year ※ As of March 2008 • Direct Tax - 100 % Exemption for first 3 Years - 50 % Exemption for next 2 years • Indirect Tax - 100% Exemption - Zero VAT Terminal Distripark 33
FCL FCL FCL FCL FCL FCL Logistics Model : Regional Distribution Center Storage, Processing, Consolidation, etc. Europe Italy France Busan NE Asia China Taiwan America US Canada Chile Advantage SE Asia - Lead-time Thailand Indonesia Malaysia Vietnam - O.L.T charge - Storage charge - Processing charge - Managing efficiency 34
North Distripark Investment : 1st Stage • New Volume from Tenant Companies : 947K TEU * Overlapping invested companies counted 35
Foreign Investment by Nations Misc. 2 Japan 21 Europe 1 37% 55% China 14 36
Opening of Logistics Center in Distripark - Busan Int’l Distribution Center : ’07. 7 ( 30,963 ㎡ ) - Busan New Port Distribution Center: ’08. 4( 37,017 ㎡ ) 37
Port Notice(e-PN) Ships Store(e-SS) Harbor Mgmt.(e-HM) Ship Yard BPA-NET MOMAF,SP-IDC eXternal N/W(e-XN) Government N/W(e-GN) Financial Customs Logistics Commerce(e-LC) Logistics EDI VAN Quarantine Intl’Network Justice Dpt Shipping Line Korail CY, Inland ICD MOCI TML Operator Shipper Air Line Trucker Ubiquitous Port - Single Window 38
Ubiquitous Port - RFID Technology GCTS/GPS RFID Automatic Recognition System Real-time Information U-Port 39
Redevelopment on Old Port Area Busan City Hall Busan Jin Station The 2nd Lotte World Custom’s Office BPA Busan Station Busan Tower Pier 3 Central Pier Pier 2 Pier 1 Passenger TML ◈Area : 1,424,000 ㎡ ◈Period : 2008 ~ 2020 ◈Investment : Public + Private
Direction of Redevelopment Plan Tour/Waterfront ParkPassenger Terminal, Culture Center Retail Complex, Hospitality Port and Logistic CenterShipping and Logistics Companies Commercial CenterFinancing, Telecommunication, Advanced Technology Center, etc. 41
< Busan Port VISION > Ⅰ. Gateway to Northeast Asia Ⅱ. High Value-Added Port Ⅲ. Ubiquitous Port Ⅳ.Tourist Friendly Port 43
www.busanpa.com BPA Marketing Dpt. T) 051-999-3065 F) 051-988-8003 BUSAN, Northeast Asia’s Largest Transshipment Hub Port Thank you !!