Download
1 / 21
210 likes | 321 Views
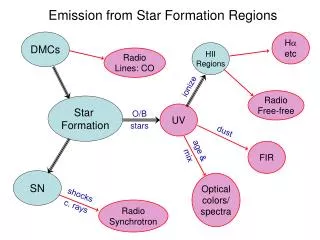
Turbulence, Feedback, and Slow Star Formation. Mark Krumholz Princeton University / UC Santa Cruz Gas Accretion and Star Formation in Galaxies MPA/ESO/MPE/USM Conference 11 September 2007 Collaborators: Tom Gardiner, Jim Stone (Princeton) Todd Thompson (Princeton / Ohio State)

E N D
Turbulence, Feedback, and Slow Star Formation Mark Krumholz Princeton University / UC Santa Cruz Gas Accretion and Star Formation in Galaxies MPA/ESO/MPE/USM Conference 11 September 2007 Collaborators: Tom Gardiner, Jim Stone (Princeton) Todd Thompson (Princeton / Ohio State) Chris McKee (UC Berkeley) Chris Matzner (U. Toronto) Jonathan Tan (U. Florida)
Outline • Embarrassing observational facts • Turbulence-regulated star formation • Star formation-regulated turbulence • Conclusions
Star Formation is Slow… (Zuckerman & Evans 1974; Zuckerman & Palmer 1974; Rownd & Young 1999; Wong & Blitz 2002) • The Milky Way contains Mmol ~ 109M of gas in GMCs (Bronfman et al. 2000), with n ~ 100 H cm–3(Solomon et al. 1987), free-fall time tff ~ 4 Myr • This suggests a star formation rate ~ Mmol / tff ~ 250 M / yr • Observed SFR is ~ 3 M / yr(McKee & Williams 1997) • Numbers similar in nearby disks
…even in starbursts… • Example: Arp 220 • Measured properties: n ~ 104 H cm–3, tff ~ 0.4 Myr, Mmol ~ 2 109 M(Downes & Solomon 1998) • Suggested SFR ~ Mmol / tff ~ 5000 M / yr • Observed SFR is ~ 50 M / yr(Downes & Solomon 1998): still too small by a factor of ~100 HST/NICMOS image of Arp 220, Thompson et al. 1997
…even in dense gas… (Gao & Solomon 2004, Wu et al. 2005, Krumholz & Tan, 2007, ApJ, 654, 304) • Example: HCN observations show LIR/L ≈ 900 LHCN/K km s–1 pc–2 • This implies a SFR ~ MHCN / 30 Myr • Critical density ~ 105 cm–3tff ~ 0.2 Myr • Again, SFR too small by factor of ~100 Galaxies MW Clumps Observed IR-HCN correlation, (Wu et al. 2005)
All Observed Star Formation is Slow!(Tan, Krumholz, & McKee, 2006, ApJL, 641, 121; Krumholz & Tan, 2007, ApJ, 654, 304)
Rant #1:(with apologies to R. Kennicutt) The oft-repeated claim that CO doesn’t really trace the “actively” star forming gas but HCN or other dense gas tracers does is misleading. The HCN isn’t all turning into stars any more than the CO is. All the SF inside the HCN clouds occurs in a few active regions containing a few percent of the mass, exactly as for the CO clouds. In other words: it’s turtles all the way down!
Implications of Slow Star Formation • For galaxy modelers: • Bad news: unless you can resolve > 105 cm–3, you cannot avoid subgrid models. • Good news: setting SFR ~1% / tff in cold gas is a good model for any maximum . • For SF theorists: • A big question is: why SF is so slow? • The answer for the SF rate (as opposed to threshold) must be at small scales (it’s not cloud formation, spiral arms, etc.).
Turbulence-Regulated SF(Krumholz & McKee, 2005, ApJ, 630, 250) • Whole cloud: PE(L) ~ KE(L), (i.e. vir ~ 1) • Linewidth-size relation: = cs (l/s)1/2 • Overdense regions can have PE(l ) ~ KE(l ) • PE = KE implies J ≈ s, where • In average region, PE(l) l5, KE(l) l4 most regions have KE(l) » PE(l) l l L • This also implies that
The Turbulent SFR • Turbulent gas has lognormal PDF of densities that depends on M • J ≈ s gives instability condition on density • Gas above critical density collapses on time scale tff • Result: an estimate SFRff ~ 1-5% for any turbulent, virialized object
Comparison to Milky Way • In MW, properties of GMCs observable • Integrate over GMC distribution to get SFR: • Observed SFR ~ 3 M / yr: good agreement! • Also reproduce radial distribution (Luna et al. 2006) • Direct test: repeat calculation once a comparable catalog is available for M33, M64, LMC.
SF Law in Other Galaxies Theory (solid line, KM05), empirical fit (dashed line, Kennicutt 1998), and data (K1998) on galactic SFRs • For other galaxies, GMCs not directly observable • Estimate GMC properties based on (1) pressure balance with ISM, (2) virial balance in GMCs • Result is SF law in terms of observables:
SF Laws in Different Tracers(Krumholz & Thompson, 2007, ApJ, in press, arXiv:0704.0792) • SF law depends on tracer: SFR LCO1.5, or SFR LHCN1.0 • Depends on ncrit: • CO: low ncrit all gas, varying n • HCN: high ncrit dense gas, fixed n • SFR ~ 0.01 M/tff; tff fixed for HCN, not CO, so CO gets extra power of 0.5 LIRLCO1.5 LIRLHCN
Star Formation- Regulated Turbulence(Krumholz, Matzner, & McKee 2006, ApJ, 653, 361) • Observed GMCs are turbulent, virialized, all have about same NH • Turbulence decays in ~1 crossing time (Stone, Ostriker, & Gammie 1998; Mac Low et al. 1998) • Large GMCs live 20–30 Myr, ~3–4 tcr, ~6–8 tff • Need to explain cloud lifetimes and invariance of cloud properties HII region in 30 Doradus, MCELS team
A Semi-Analytic GMC Model Mg, M*, R, dR/dt, • Goal: model GMC energy and momentum budget, including decay of turbulence, turbulent driving and mass loss due to HII regions • Evolution eqns: non-equilibrium virial theorem and energy conservation
Clouds Stay Near Observed Values of vir, NH, tdep M=104 M No clouds vir=3 GMCs NH,22=1 Massive clouds all have vir = 0.5 – 3 (Heyer et al. 2001) GMCs in MW and LG all have NH ~ 1022 cm–2(Blitz et al. 2006) Depletion time constant, ~1 Gyr (Wong & Blitz 2002)
Global Results • Large clouds quasi-stable, live 20-40 Myr: agrees with observed ~30 Myr lifetime of LMC GMCs (Fukui et al. 2007)! • Small clouds live ~1 crossing time, consistent with small, local clouds
Next Step: Ionization MHD Simulations (Krumholz, Stone, & Gardiner 2007, ApJ, in press, astro-ph/0606539)
Conclusions • Star formation is SLOW on all scales, in all environments • Feedback-driven turbulence can explain this observation • This model explains / predicts: • Low SFR even in very dense gas • GMC lifetimes and properties • Rate of star formation in MW • Kennicutt Law and IR-HCN correlation
Final caveat: this is all from someone dumb enough to agree to give a talk in Garching today and a talk in Heidelberg tomorrow morning… 3.5 hours!