Download

1 / 15
150 likes | 309 Views
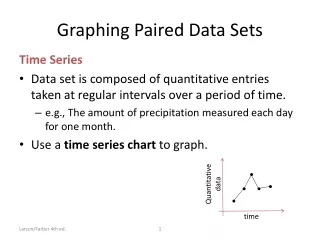
Data Sets . Math from the Real World. Hot and Cold in Mount Vernon. Avg. low, mean, high temps In Mount Vernon In degrees Fahrenheit. Hot and Cold in Mount Vernon. Avg. low, mean, high temps . Connecting the dots. Hot and Cold in Mount Vernon. Now we repeat the pattern over three years.

E N D
Data Sets Math from the Real World
Hot and Cold in Mount Vernon Avg. low, mean, high temps In Mount VernonIn degrees Fahrenheit
Hot and Cold in Mount Vernon Avg. low, mean, high temps Connecting the dots
Hot and Cold in Mount Vernon • Now we repeat the pattern over three years. • This allows us to predict average temperatures in the future.
Ball Toss Horizontal pos. vs. time Vertical pos. vs. time
Ball Toss Horizontal pos. vs. time Vertical pos. vs. time
Body Proportions Armspan vs. height (cm.) Footlength vs. height (cm.)
Body Proportions Armspan vs. height (cm.) Foot length vs. height (cm.)
Radioactive Decay (Indium) • Thanks to Mr. K. in the Physics lab for giving us this data. • The data were generated from the decay of indium foils that were exposed to our neutron source and counted with a Geiger counter .
Radioactive Decay (Indium) • Thanks to Mr. K. in the Physics lab for giving us this data. • The data were generated from the decay of indium foils that were exposed to our neutron source and counted with a Geiger counter .
Bacillus subtilis growth curve data • Thanks to Prof.Slonczewskiin the biology department for giving us this data. • Bacteria were placed in media with pH of 6 and 7.4 and allowed to grow. Then they were “thinned out into fresh media of varying pH (6 to 6 and 7.4; 7.4 to 7.4 and 8.8) to see which pH shift most negatively affected the growth.
pH 6 to 6 and 7.4 pH 7.4 to 7.4 and 8.8 Conclusions?