Download
1 / 46
600 likes | 1.07k Views
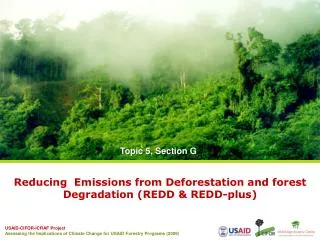
Topic 5, Section G. Reducing Emissions from Deforestation and forest Degradation (REDD & REDD-plus). Learning outcomes.

E N D
Topic 5, Section G Reducing Emissions from Deforestation and forest Degradation (REDD & REDD-plus)
Learning outcomes In this presentation you will learn about th Reducing Emissions from Deforestation and Degradation (REDD) programme. You will also learn about the latest developments of the REDD+ programme. Topic 5, Section G, slide 2 of 46
Outline • Background and history of REDD • Definitions • Forest transitions • Why include REDD • Key issues and implications • Latest developments: REDD-plus Topic 5, Section H, slide 3 of 46
Causes of deforestation Direct causes • agricultural/ bioenergy expansion • wood extraction/ logging • infrastructure development • Underlying causes • macroeconomic factors • governance factors • political factors • technological factors • cultural factors • demographic factors Topic 5, Section G, slide 4 of 46
Global emissions (1850-2000) Topic 5, Section G, slide 5 of 46
Annual average deforestation rate (1000 hectares/year) in 2000-2005 10 countries: 71% of total Data: FAO Topic 5, Section G, slide 6 of 46
Total CO2 emissions from land use and other sectors in selected countries (2000) Data: WRI Topic 5, Section G, slide 7 of 46
Background • The Kyoto Protocol only addresses afforestation and reforestation to enhance the sink of GHG emissions • Avoided deforestation was not included because countries have different circumstances in the Land Use, Land-Use Change and Forestry (LULUCF) sector, hence equity was an issue • Afforestation and reforestation through the Clean Development Mechanism (CDM) has not been very promising • In fact, addressing avoided deforestation would address 20% of the global emissions which is equivalent to 1.6 billion tons of carbon per year (1.6 gigatonnes of carbon a year) • SBSTA (Subsidiary Body for Scientific and Technological Advice) Topic 5, Section G, slide 8 of 46
History of REDD • Submissions of the Governments of PNG and Costa Rica (FCCC/CP/2005/MISC.1) • COP11 initiated a 2-year process of reducing emissions from deforestation - RED (FCCC/CP/2005/L.2) • SBSTA invited submissions from Parties and Observers to stimulate actions • The second ‘’D’’ (forest Degradation) was considered in COP13 • SBSTA organised workshops • Rome, September 2006 • Cairns, March 2007 • Tokyo, May 2008 • Bonn, October 2008 • REDD was broadened to REDD+ in early 2009 Topic 5, Section G, slide 9 of 46
Full REDD Implementation Timeframe of processes of the United Nations Framework Convention on Climate Change (UNFCCC) Kyoto Marrakesh Bali Copenhagen | | | | | | | Post 2012 1990 97 2002 07 08 09 12 Kyoto Base year 1st Commitment Period Under Kyoto Protocol REDD Readiness Phase Topic 5, Section G, slide 10 of 46
Bali road map:Indicative guidance (1/2) • Demonstration activities should be undertaken with the approval of the host Party • Estimates of reductions or increases of emissions should be results-based, demonstrable, transparent, and verifiable, and estimated consistently over time • The use of the methodologies is encouraged as a basis for estimating and monitoring emissions • Emission reductions from national demonstration activities should be assessed on the basis of national emissions from deforestation and forest degradation • Sub-national demonstration activities should be assessed within the boundary used for the demonstration, and for associated displacement of emissions Topic 5, Section G, slide 11 of 46
Bali road map: Indicative guidance (2/2) • Reductions in emissions or increases resulting from the demonstration activity should be based on historical emissions, taking into account national circumstances • Sub-national approaches, where applied, should constitute a step towards the development of national approaches, reference levels and estimates • Demonstration activities should be consistent with sustainable forest management and considers the relevant provisions of the United Nations Forum on Forests, the United Nations Convention to Combat Desertification and the Convention on Biological Diversity Topic 5, Section G, slide 12 of 46
Definitions • Forest is defined structurally on the basis of crown cover percentage, minimum height and minimum area of stand: • forest area between 0.05 and 1 hectare • potential to reach a minimum height at maturity in situ of 2 to 5 metres • Tree crown cover (or equivalent stocking level): 10% to 30% (Decision 19/CP9) - Kyoto Protocol definition • Deforestation is defined as the direct, human-induced conversion of forested land to non-forested land (Decision 11/CP.7) - Kyoto Protocol definition • Degradation is defined as a direct, human-induced, long-term loss (persisting for X years or more) or at least Y% of forest carbon stocks [and forest values] since time T and not qualifying as deforestation. The parameters X,Y and T have not been defined (Penman et al., 2003) - IPCC definition Note: No definition has been approved to be used in REDD+ in current negotiations. The above definitions are from the Kyoto Protocol or from the IPCC Topic 5, Section E, slide 13 of 46
Deforestation and degradation Land use change? Yes Deforestation No Loss of C? Degradation Yes Topic 5, Section E, slide 14 of 46
Forest cover Papua New Guinea/ Democratic Republic of Congo Indonesia/Brazil China/Costa Rica India Time Forest transition Forest frontiers Forest/agric.mosaics Undisturbed forests Forest/plantations/ agric. mosaics Source: Kanninen et al. (2007) Topic 5, Section G, slide 15 of 46
Why include REDD in a global climate regime? • BIG: • 1/5 of GHG emissions, but • not included in global climate regime • CHEAP: (Stern report) • negative - US$5/tonne • 50% red: US$5-15 billion • but problems of implementation (transaction costs) • QUICK: • stroke-of-pen reforms • no deep restructuring of economy or new technoloigy • a wooden bridge to a clean energy future • WIN-WIN: • large transfer • good governance? Topic 5, Section G, slide 16 of 46
Why include … (cont.) • Initiated by developing countries • Less resistance from environmental groups • Poor countries: an opportunity to receive large transfers by selling carbon credits • Rich countries: a cheap way to undertake mandatory reductions Topic 5, Section G, slide 17 of 46
The ‘ideal’ REDD scheme Topic 5, Section G, slide 18 of 46
Key issues and implications Topic 5, Section G, slide 19 of 46
Key messages: • Technical solutions exist, but • Often trade-offs • Political issues • Flexibility needed: • country circumstances • learning process Topic 5, Section G, slide 20 of 46
1. Scope of REDD Forest carbon (C) = forest area (ha) * carbon density (t/ha) Topic 5, Section G, slide 21 of 46
2. What to credit? Input Output Strong arguments for emission-based approach: • incentives should aim at the target • generate tradable REDD credits (tap into compliance market) Problems with stock-based approach: • water out the mechanism, incentives at the margin • low additionality Policies and measures (PAM) Emissions:Change in stocks Stocks (level, or pct. of level) Topic 5, Section G, slide 22 of 46
3. Finding the right scale Credit to countries, projects or both? • National approach • creates country ownership • addresses domestic leakage • susceptible to governance failures • less likely to mobilise private investment • Sub-national approach • allows early action and wide participation • susceptible to domestic leakage • cannot address wider driving forces of deforestation and forest degradation • Nested approach • allows early start with sub-national activities and gradually moves to a national approach • challenges to harmonise two levels Topic 5, Section G, slide 23 of 46
4. Finding the money (example: US$15 billion annually for 50% cut) Development aid or public funds Voluntary markets • Compliance markets • Selling REDD credits (fungibility) • Auctioning Emission Allowances • Tax on carbon trade Topic 5, Section G, slide 24 of 46
5. Setting the reference levels Topic 5, Section G, slide 25 of 46
Reference levels(cont.) Business as usual (BAU): • national historical deforestation • national circumstancesforest cover-stage in foresttransition • GDP/capita Crediting baselines: • BAU + common but differentiated responsibilities • no-lose systems (Crediting baseline < BAU): • who owns the REDD rent? In the end: a balance between the risk of ’tropical hot air’ and REDD participation and acceptability Topic 5, Section G, slide 26 of 46
6. Avoiding leakage (emission displacements) • Monitor: The Voluntary Carbon Standard for land-use projects and the BioCarbon Fund now recommend leakage-belt monitoring; 5 to 7 times the size of project areas greater than 100,000 hectares; 20 to 40 times the size of project areas less than100,000 hectares • Increase Scale:Move from sub-national to national levels. For international leakage, get broad participation • Discount:The various UNFCCC-proposed mechanisms, such as banking non-credited conservation reserves, insurances, discounted credits, or leakage-adjusted baselines and targets. Reward better monitoring • Redesign:How large are leakage risks for different on-the-ground REDD actions? Priority to less mobile deforesting agents? • Neutralise:Example: neutralizing ‘alternative livelihoods’ components, Integrated Conservation and Development Projects • Leakage a sign of a healthy economy • Must accept some leakage • Move to national level Topic 5, Section G, slide 27 of 46
7. Ensuring permanence and assigning liability Is permanence a particular REDD problem? • difficult to control the carbon storage, for example fires • continued monitoring and incentives But: • given the finiteness of fossil fuels, it is likely that they will end up in the atmosphere over the long run • even if terrestrial carbon sequestration was in fact temporary, it will still have a positive climate effect: “A wooden bridge to a clean energy future” The real problem: • lack of national caps and targets (and liability for those) • liability management schemes needed as part of REDD Topic 5, Section G, slide 28 of 46
8. Monitoring, reporting and verifying (MRV) Stock-difference approach Gain-loss approach Topic 5, Section G, slide 29 of 46
MRV (cont.) • The technologies are (almost) there • But they come at a cost, sometimes a very high cost • The more disaggregated data, the more expensive it is • MRV not an hindrance for moving ahead, but impose limitations for what we can do • IPCC guidelines are fairly good for deforestation, less developed for degradation • Conservativeness principle • A global REDD scheme flexible enough to avoid discriminating against countries with low MRV capacity • Reward better MRV Topic 5, Section G, slide 30 of 46
9. How to deal with degradation? Should we include degradation (“second D”)? • Opposing views on whether or not it should be included • More complicated to define, measure and monitor than deforestation • With degradation, REDD would more effective in achieving the goals of the convention by accounting for a wider range of forest greenhouse gas emissions • Inclusion of degradation increases international equity of the REDD mechanism by encouraging participation by a wider range of countries, many of them in Africa • Inclusion allows for promotion of sustainable forest management, rehabilitation and restoration • Leaving degradation out can lead to increased leakage Topic 5, Section G, slide 31 of 46
10. Generating REDD co-benefits Why Should REDD be pro-poor? • Moral arguments: legitimate rights • Practical considerations: forest users/managers are often poor, and need incentives • Risk reduction: risk of local rejection, social conflict • Attractiveness of REDD investments greater • Political considerations: REDD funds from international donors and development agencies • Procedural matters: the UNFCCC recognises the importance of social issues, including poverty, as global priorities (Decision 2/CP.13). Topic 5, Section G, slide 32 of 46
REDD Co-benefits (cont.) • Opportunities of poor country participation: • nested approach, soft entry • readiness, ODA funding • ‘national circumstances’: a challenge • Recognise other international conventions (CBD, Aarhus) • Some tradeoffs: carbon effectiveness and equity • Mainly determined by national REDD strategies Topic 5, Section G, slide 33 of 46
FCPF and UN-REDD World Bank FCPF (37 countries) UN-REDD (9 countries) Both FCPF and UN-RDDD (5 countries) FPCP Donors: Australia, Finland, France, Germany, Japan, the Netherlands, Norway, Spain, Switzerland, UK, and USA Topic 5, Section G, slide 34 of 46
FCPF Readiness Plan Idea Note (R-PIN) and R-Plan submissions Africa (14) Ghana Liberia DRC Gabon CAR Cameroon Eq. Guinea Congo Rep. Kenya Ethiopia Mozambique Tanzania Uganda Madagascar • Tropical America (15) • Panama* • Guyana* • Costa Rica • Bolivia • Mexico • Argentina • Colombia • Nicaragua • Paraguay • Peru • Asia Pacific (8) • Indonesia* • Lao PDR • Nepal • Vietnam • Vanuatu • PNG • Thailand • Cambodia Note: * = Country submitted R-Plan Topic 5, Section G, slide 35 of 46
World Bank’s FCPF • A $100 million Readiness Mechanism to provide grants to 20 countries that would fund projects including: • measurement, monitoring and verification systems to enable countries to report on emissions • adopting a national REDD strategy that reflects each country’s priorities • developing a national reference scenario for REDD • A $200 million Carbon Finance Mechanism (to be spent over ~5 years, beginning in 2010) to allow some of these countries to run pilot programmes earning credits for deforestation Topic 5, Section G, slide 36 of 46
UN-REDD • FAO, UNDP and UNEP - a joint UN Collaborative programme on REDD in developing countries • Two elements: • Assisting developing countries to prepare and implement national REDD strategies and mechanisms, • Supporting the development of normative solutions and standardised approaches for a REDD instrument linked with the UNFCCC • Readiness programme: • Development of monitoring and assessment capability and methodologies • Main donor: Norway Topic 5, Section G, slide 37 of 46
Forest transition of FCPF and UN-REDD countries High Deforestation Rate (> 0.5% year) Low Deforestation Rate (< 0.5% year) Democratic Republic of Congo, Colombia, Guyana, Panama, Peru, Costa Rica Indonesia, Papua New Guinea, Lao PDR, Bolivia, Paraguay, Nicaragua High Forest Cover (> 40%) Low Forest Cover (<40%) Nepal, Ethiopia, Ghana, Liberia, Tanzania, Uganda Vietnam, Kenya, Madagascar, Mozambique Topic 5, Section G, slide 38 of 46
Outlook: REDD funding scheme Readiness Pilot Market Total funding Funding Market-based Fund-based 2008 2012 2016 2020 Modified after Eliasch (2008) Topic 5, Section G, slide 39 of 46
REDD+ • There seems to be a general consensus that REDD activities should be broadened • New term – REDD+ – is launched • REDD+ relates to • reducing emissions from deforestation and forest degradation in developing countries • and the role of conservation, sustainable forest management and enhancement of forest carbon stocks in developing countries Topic 5, Section G, slide 40 of 46
IPCC definitions Topic 5, Section G, slide 41 of 46
REDD Conservation Enhancement of C-Stocks REDD and REDD+ SFM Source: Pedroni (2009) Topic 5, Section G, slide 42 of 46
Outlook • Will REDD+ make it to the post 2012 agreement? • Several demonstration activities, or planned experiments, are starting • Start quickly to gain experience • Phased approach: • MRV more precise methods (learning by doing) • projects national level (but a different ball game) • funds market-based mechanisms over a transition period Topic 5, Section G, slide 43 of 46
References • Brown, S. and Gaston, G. 1995 Use of forest inventories and geographic information systems to estimate biomass density of tropical forests: applications to tropical Africa. Environ. Monit. Assess. 38:157-68. • Brown, S., Hall, M., Andrasko, K., Ruiz, F., Marzoli, W., Guerrero, G., Masera, O., Dushku, A., de Jong, B. and Cornell, J. 2007 Baselines for land-use change in the tropics: application to avoided deforestation projects. Mitigation and Adaptation Strategies for Global Change 12:1001-26. • CIFOR Infobrief 15. 2008. What is the right scale for REDD? The implications of national, subnational and nested approaches” by Arild Angelsen, Charlotte Streck, Leo Peskett, Jessica Brown & Cecilia Luttrell (http://www.cifor.cgiar.org/publications/pdf_files/Infobrief/015-infobrief.pdf) • CIFOR Infobrief 16. 2008. Measuring and monitoring forest degradation for REDD: Implications of country circumstances” by Daniel Murdiyarso, Margaret Skutsch, Manuel Guariguata, Markku Kanninen & Cecilia Luttrell, Pita Verweij and Osvaldo Stella (http://www.cifor.cgiar.org/publications/pdf_files/Infobrief/016-infobrief.pdf) • Kanninen, M., Murdiyarso, D., Seymour, F., Angelsen, A., Wunder, S. & German. L. 2007. Do Trees Grow on Money? The implications of deforestationresearchforpoliciestopromote REDD. Forest Perspectives No. 4, Center for International Forestry Research (CIFOR), Bogor, Indonesia. 61 p.. (http://www.cifor.cgiar.org/publications/pdf_files/Books/BKanninen0701.pdf) • Meridian Institute. 2009. Reducing Emissions from Deforestation and Forest Degradation (REDD): An Options Assessment Report. Prepared for the Government of Norway, by Arild Angelsen, Sandra Brown, Cyril Loisel, Leo Peskett, Charlotte Streck, and Daniel Zarin. Available at: http://www.REDD-OAR.org Topic 5, Section G, slide 44 of 46
References (con’t) • Pearson, T., Walker, S. and Brown, S. 2005 Sourcebook for land use, land-use change and forestry projects. Winrock International and the BioCarbon Fund of the World Bank. 57p. • Penman, J. et al. 2003 Good practice guidance for land use, land-use change and forestry. IPCC National Greenhouse Gas Inventories programme and Institute for Global Environmental Strategies, Kanagawa, Japan. http://www.ipcc-nggip.iges.or.jp/public/gpglulucf/gpglulucf.htm • Angelsen. A. (Ed.). Moving Ahead with REDD: Issues, Options and Implications. Center for International Forestry Research (CIFOR), Bogor, Indonesia. Pp. 99-106. http://www.cifor.cgiar.org/publications/pdf_files/Books/BAngelsen0801.pdf. Topic 5, Section G, slide 45 of 46