Download
1 / 37
370 likes | 451 Views
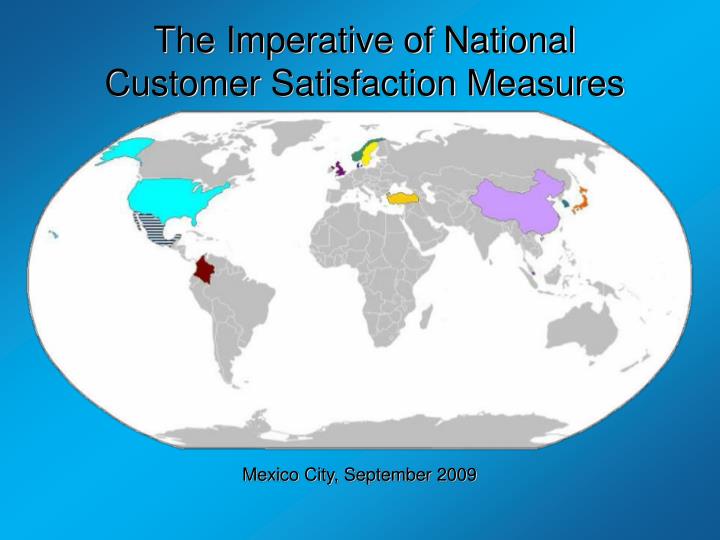
The Imperative of National Customer Satisfaction Measures. By Professor Claes Fornell University of Michigan. Mexico City, September 2009. Sustainable Economic Growth. Sources of Economic Growth. Productivity. Quality. Benefits to the Economic Decision Makers. Investors

E N D
The Imperative of National Customer Satisfaction Measures By Professor Claes FornellUniversity of Michigan Mexico City, September 2009
Sustainable Economic Growth Sources of Economic Growth Productivity Quality
Benefits to the Economic Decision Makers • Investors • Business Managers • Government • Consumers
Investors Need to Know… The relationship between a firm’s current condition and its future capacity to produce wealth
Managers Need to Know… How to improve the firm’s current condition by allocating scarce resources such that the strength of the customer relationships are maximized
Government Needs to Know… How to best encourage economic growth and living standards for its citizens
Consumers Need to Have… A voice in measures that reflect their economic living standards
Why Now? The Economy is Changing
Why Now? The Global Forces • Movement of: Information Capital Work (not labor) Shift in the balance of power in favor of the buyer – at the expense of the seller
Consumer utility is the true standard for economic growth Sellers compete for buyer satisfaction
Implications • The cost of poor service will be borne by the seller • When buyers are powerful, assets of supply (balance sheet assets) have little predictive power • Productivity and quality of economic output must be better balanced • Capital follows power
ACSI: A Growing Presence in the US “The American Customer Satisfaction Index, the definitive benchmark of how buyers feel about what business is selling them.” - New York Times, August 8, 2004
A Brief Introduction to ACSI: Data 280,000 telephone numbers Sampled randomly Screened: Recent experience as a customer of the selected companies 80,000 telephone interviews + 4,000 internet interviews
A Brief Introduction to ACSI: Analysis The ACSI Equations whereh¢ = (h1, h2, ..., hm) and x¢ = (x1, x2, ..., xn) are vectors of unobserved endogenous and exogenous variables,respectively;B (mxm) is a matrix of coefficient parameters forh; andG (mxn) is a matrix of coefficient parameters forx. The PLS estimation implies thatE[hz¢] = 0, E[xz¢] = 0,andE[z] = 0, where z = h - E[h|h, x].
A Brief Introduction to ACSI: Analysis The ACSI Equations
A Brief Introduction to ACSI: Analysis The ACSI Equations wherey¢ = (y1, y2, ..., yp) and x¢ = (x1, x2, ..., xq) are the measured endogenous and exogenous variables, respectively. Ly (px m) and Lx (qx n) are the corresponding regression coefficient matrices. By implication from PLS estimation (Fornell and Bookstein, 1982), the noise or measurement error has the properties E[e] = 0, E[d] = 0, E[he¢] = 0, and E[xd¢] = 0.
A Brief Introduction to ACSI: Analysis The ACSI Equations
ACSI Scores – National, Sector & IndustryQ3 2008 – Q2 2009 76.1 Utilities 73.7 E-Business 81.5 74 Internet News & Information 83 Internet Portals/Search Engines Energy Utilities 74 83 Food Manufacturing 84 Pet Food 79 Athletic Shoes 85 Personal Care & Cleaning Products 83 Soft Drinks 83 Breweries 78 Cigarettes 80 Apparel Transportation 72.6 Manufacturing/Nondurable Goods 82.3 Airlines 64 U.S. Postal Service 74 Express Delivery 82 Newspapers 63 Motion Pictures 74 Computer Software 75 Fixed Line Telephone Service 72 Wireless Telephone Service 69 Cellular Telephones 72 Cable & Satellite TV 63 Network Cable TV News 71 Information 70.2 Public Administration/ Government 67.9 68.0 Local Government 67.8 Federal Government 76 Supermarkets 74 Gasoline Stations 74 Department & Discount Stores 76 Specialty Retail Stores 78 Health & Personal Care Stores Health Care & Social Assistance 78.5 Retail Trade 75.2 Hospitals 77 Ambulatory Care 80 75 Banks 84 Credit Unions 73 Health Insurance 78 Life Insurance 81 Property & Casualty Insurance Accommodation & Food Services 78.9 Finance &Insurance 76.0 Hotels 75Full Service Restaurants 84Limited Service Restaurants 78 Personal Computers 75 Electronics (TV/VCR/DVD) 83 Major Appliances 81 Automobiles & Light Vehicles 84 Manufacturing/Durable Goods 81.6 E-Commerce 80.0 82 Retail 74 Brokerage 75 Travel
Perceived Product Quality Perceived Service Quality • Reliability • Customization • Overall • Reliability • Customization • Overall Customer Complaints Perceived Overall Quality Customer Satisfaction (ACSI) • Overall • Customization • Reliability • Complaint Behavior Perceived Value • Price Given Quality • Quality Given Price • Satisfaction • Comparison w/ Ideal • Confirm/Disconfirm • Expectations Customer Expectations Customer Loyalty • Overall • Customization • Reliability • Repurchase Likelihood • Price Tolerance • (Reservation Price) A Brief introduction to ACSI: Graphic Model
Growth in ACSI and Consumer Spending:1995 – 2009 (Q2) 8% 7% 6% 5% 6% 4% 3% 4% 2% 1% 2% 0% Annualized, Seasonally Adjusted Rate of Growth - 1% 0% - 2% - 3% - 2% - 4% - 5% - 4% - 6% % Quarterly Change in Consumer Spending - 7% % Quarterly Change in ACSI (lagged) - 6% - 8% Source: Consumer Spending from U.S. Department of Commerce, Bureau of Economic Analysis
Information Capital Work (not labor) The Global Context • Global Forces: How do they affect the buyer-seller relationship?
The Buyer – Seller Relationship • Who Benefits Most? The buyer • Who is getting more choice? The seller • Who is becoming more replaceable?
The Buyer – Seller Relationship • The Result: The balance of power between buyers and sellers is shifting in favor of the buyer.
The Effects Punishment and Rewards Corporate Balance Sheets Capital Movements Business Strategy
For Investors: Do customers know something investors don’t?
The Conventional Answer: No, because markets are efficient and reflect all available information
But… How does this information reach investors (satisfied customers are not on the balance sheet)?
Shift in Power Between Buyer and Sellers Capital Follows Power
The Successful Seller Product Markets Repeat Buying Seller More Capital Equity Markets Rewards and Punishment
The Unsuccessful Seller Punished by: Rewards and Punishment • Buyer defection in product markets • Capital withdrawal from equity markets
Can You Beat the Market? Only if you know something that others don’t
36% 26% 22% 31% 22% 16% 14% 13% 11% 9% 18% 4% 3% -6% -9% -12% -13% -23% -26% -39% 10 Years of Annual Returns CSAT Stock Portfolio 2000 - 2009* 50% S&P 500 40% ACSI Stock Portfolio 30% 20% 10% Yearly Performance 0% -10% -20% -30% -40% -50% 2000 2001 2002 2003 2004 2005 2006 2007 2008 2009 *2009 is YTD through September 18
Even Lower Risk – Market Neutral vs. HFRX Equity Market Neutral Index *2009 is YTD through July
From Investment to Business Management Good Customer Asset Measurement Tells Us: • What the company has doneto its customers • What customers will doto the company • What the company can doto affect the above in the future
For Management What Losers Do • Buy customer loyalty with price discounts • Get short term profit at the expense of weakening customer relationships • Get too close to the customer • Try to exceed customer expectations
For Management What Winners Do • Manage customer relationships as true economic assets • Balance productivity and service quality • Maximize customer complaints • Earn loyalty of customers by satisfying them • Combine time and space