Download
1 / 40
400 likes | 547 Views
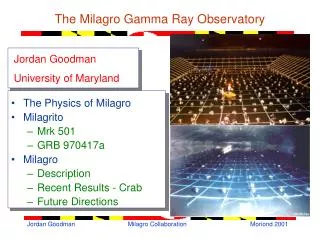
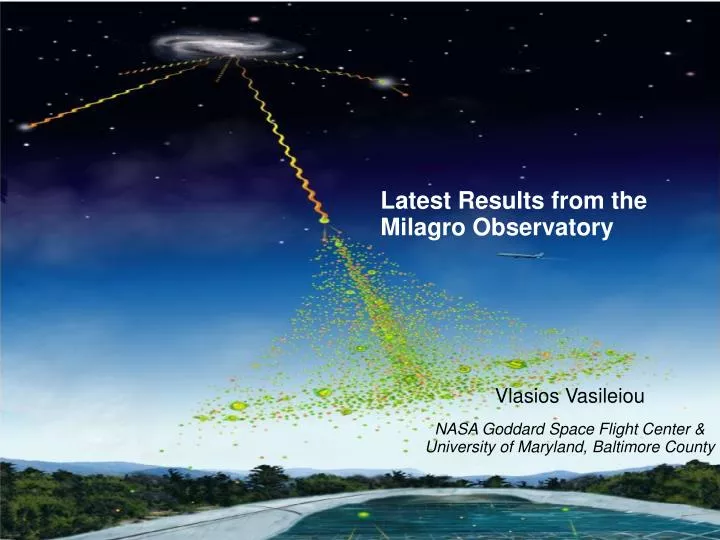
Vlasios Vasileiou NASA Goddard Space Flight Center & University of Maryland, Baltimore County. Latest Results from the Milagro Observatory. Overview. The Milagro Detector (Some of the) Latest Results Gamma-ray Observations Survey of the galactic plane

E N D
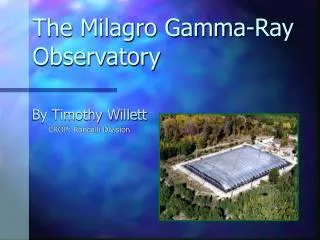
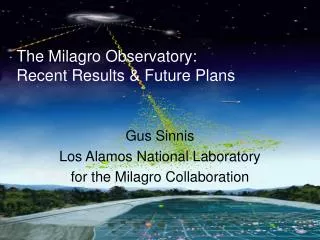
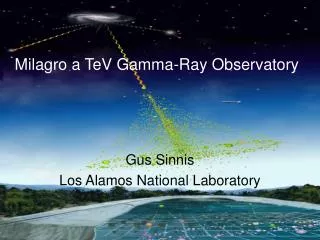
Vlasios Vasileiou NASA Goddard Space Flight Center & University of Maryland, Baltimore County Latest Results from the Milagro Observatory
Overview • The Milagro Detector • (Some of the) Latest Results • Gamma-ray Observations • Survey of the galactic plane • Diffuse emission from the galactic plane • Cosmic Rays • Large-scale anistropy • Discovery of two regions of excess Cosmic Rays • Gamma-Ray Bursts • Triggered & untriggered (blind) searches • Conclusion
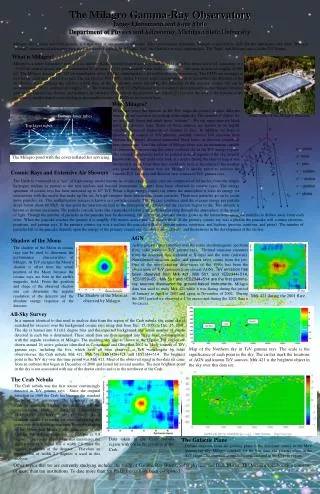
The Milagro Observatory • Water-Cherenkov detector located at the Jemez mountains near Los Alamos, New Mexico. • Elevation: 2630 m • Detector Components: • Central Pond • Outrigger Array
e μ γ 8 meters The Central Pond Primary Particle Thickness ≈ 1 m • 24Million liter reservoir of highly purified water • Covered with a light-tight cover • 80m x 60m x 8m (depth) (5000 m2) • 723 PMTs arranged in two layers • Air Shower Layer: 450 PMTs under 1.4 m of water • Triggering • Direction Reconstruction • Muon Layer: 273 PMTs under 6m of water • Background Rejection • Energy Reconstruction Ө Shower Front (Diameter ≈ 100 m) 50 meters 80 meters
. . . . . . . . . . . . . . . . The Outrigger Array • Outrigger Array • 175 Water tanks spread over 40,000 m2 • Contain water and a downwards facing PMT • Added 2003 • Improved • Effective area • Angular resolution • Energy resolution • Background rejection
Milagro's Performance • Angular reconstruction accuracy 0.3o-1.4o • Most of the effective area at TeV energies • ~105 m2 @ 10 TeV • ~10 m2 @ 100 GeV • Median energy of triggers ~few TeV (for a Crab-like source) • Performance: • Wide field of view (~2 sr) • High duty cycle (~90%) • Good for unbiased whole-sky searches, observations of large-scale features & anisotropies, monitoring for transient emissions (flares, GRBs). • Crab-like source • Milagro ~8σ/sqrt(year)
Cygnus Region 90° 65° 30° 210° The Northern Sky at 20 TeV Crab Nebula • 6.5 year data set (July 2000-January 2007) ApJ 664 (2007) L91
C4 J2226+60 EGRET MGRO J2031+41 (GeV J2035+4214) MGRO J2005+33 (high matter density?) MGRO J2226+60 (Boomerang PWN) MGRO J2019+37 (GeV J2020+3658) MGRO J2044+36 (no counterpart) MGRO J1908+06 (GeV J1907+0557) MGRO J2031+36 (extension of J2019?) 106 108 MGRO J0634+17 (Geminga) Crab nebula C3 J0634+17 Geminga Cygnus Region GeV 1907+0557 • GeV Sources Geminga • Milagro has discovered3 new sources & 4 candidate sources in the Galaxy. • 5/7 of these TeV sources have GeV counterparts (only 13 GeV counterparts in this region - excluding Crab) • Probability = 3x10⁻⁶
Crab Source Exclusion • The signal regions (shown with the squares) were fit with a two-dimensional Gaussian plus a constant.
Diffuse Emission Cygnus Region with Matter Density Contours overlaying Milagro Significance Source Subtracted Longitude Profile by Milagro GALPROP (optimized): Sum πo decay Inverse Compton Cygnus Region Below Horizon
EGRET Milagro Inner galaxy Cygnus region Milagro and GALPROP predictions • Extragalactic diffuse • Bremsstrahlung • πo decay • Inverse Compton (dashed line: IC on the CMB) • Sum of the above three contributions
Profiles of the Galactic Diffuse Emission Inner Galaxy 30o<longitude<65o • Inverse Compton component extends to higher latitudes • Pion decay due to interactions with matter mostly at low latitudes • Profile of Milagro’s measurements at Cygnus region is narrower than GALPROP’s predictions -> possibly a stronger pion component is involved Cygnus Region 65o<longitude<85o GALPROP Model o decayInverse ComptonTotal
Milagro Observes Anisotropy in 10 TeV Cosmic Rays • Milagro’s standard point-source analysis with a 10o bin size • Results: • Two regions of fractional excess of 6e-4 (Region A) and 4e-4 (Region B) above the cosmic ray background were detected. • Composition: • Excesses are not gamma rays (or electrons), but charged cosmic rays (8.6σ Region A and 6.6σ Region B). • Energy Spectrum: • The spectra of both excesses are inconsistent with the cosmic-ray spectrum (4.6σ and 2.5σ) • Spectrum of region A: Broken power-law with index = -1.45 and break energy=9TeV. Galactic Plane Heliotail Geminga
Tibet Collaboration ICRC Merida 2007 Cygnus region Mrk421 Crab ? Tibet icrc 02007
Origin/Explanation of the Excesses • Composition: • Not photons or electrons • Neutrons from a star? Unlikely -> 10 TeV neutrons decay in 0.1pc -> much closer than the nearest star. • Gyroradius of a 10TeV proton in a 2μG magnetic field (estimate of the local Galactic field) is only ~0.005pc (1000AU). • Magnetic field must connect us to the source and be coherent out to it (>=100pc). • Tips: • Connection to heliosphere? Region A coincides with the direction of the heliotail. • The direction of both regions is nearly perpendicular to the expected Galactic magnetic field direction. • Multiple explanations were proposed: • Salvati & Sacco, astro-ph:0802.2181 • Drury & Aharonian, astro-ph:0802.4403 • K. Munakata for M. Amenomori AIP Conf Proc Vol 932, page 283
Large-Scale Cosmic Ray Anisotropy • To study anisotropies with scale larger than 10o, an alternative method was used. • Can detect effects down to the 10-4 – 10-3 level. • Measures the fractional (not absolute) anisotropy in the RA direction. • Median Energy 6 TeV
Large-Scale Cosmic-Ray Anisotropy Galactic North Pole • Define “central-deficit region”: • Dec: 5o-35o & RA : 160o-210o • Symmetric around minimum at RA=188o • Average fractional anisotropy: -2.85 ± 0.06 ± 0.08 x 10⁻³ (20σ) • Coincident with the Galactic North Pole
Properties of the Central-Deficit Region 07/2007 ~ Solar minimum 07/2000 ~ Solar maximum • Mean anisotropy of central-deficit region increases with time (~ factor of 2 / 7 yrs). • Trend present in all energies • Tibet found no evidence of fluctuation: Mean anisotropy at 1997-2001 =~ 2001-2005 • Average value of the anisotropy depends on the energy -> decreases at high energies
Possible Explanations • Effects that can create anisotropies • Large scale or local magnetic field configurations • Effects of the heliosphere • Anisotropy observed to energies up to 100TeV -> CR of such high energies are not easily influenced by the heliosphere • Diffusion of cosmic rays out of the Galactic halo • Supported by the fact that the deficit is close to the North Galactic Pole • Contribution of discrete sources (such as supernova remnants) • Compton-Getting effect -> dipole effect due to the motion of the solar system with respect to the CR plasma -> increase in CR flux of the order of 0.1% in the direction of motion. • Energy independent • Observed effect different than the predicted effect.
Milagro’s Searches for GRBs • Triggered • In coincidence with external triggers (ex. from Swift) • Using the reconstructed events (E>100 GeV) • Using the individual PMT hit-rates (E<100GeV) • Published upper limits at ICRC Merida & Santa-Fe GRB Conferences 2007 • Comprehensive paper with upper limits in preparation • Untriggered (Blind) • Search of all of the Milagro data in space, starting time, duration • Simple binned search • Careful calculation of the effective number of trials • Optimization of the bin-size versus the duration under search
Sensitivity to GRBs (Untriggered Search) Fluence Sensitivity Minimum Detectable Redshift *Swift data: N. Butler et al. ApJ 2007
Blind Search for GRBs • Searched 4.6 years of Milagro data for bursts of VHE gamma rays of duration from 0.1msec to 316sec. • The search was also sensitive to other transient phenomena such as the last stages of primordial black hole evaporation. • No significant events were detected. • Upper limits on the prompt VHE emission from GRBs were set. • Best post-trials probabilities found in each duration • Need to multiply these probabilities with an extra factor of 41 to account for the number of independent durations searched.
Setting Upper limits on VHE emission from GRBs • Next step: Set upper limits on the VHE emission from GRBs • A VHE emission model that predicts -ln(1-CL) GRB detections by this search is excluded at the CL level. • 2.3 detections -> exclude a model at the 90% Confidence Level • A simulation of the GRB population was created to estimate the number of GRB detections. • The simulation reproduced the (Eiso, z, t90) distributions of GRBs detected by Swift. • Using the Swift GRB rate and the relative FOV’s of Milagro and Swift we can calculate the rate of (detectable by Swift) GRBs in Milagro’s FOV. • Using Milagro’s sensitivity data we can calculate the number of GRB detections by Milagro.
Simulation Details • Redshift distributions • Detected distribution = Intrinsic distribution x detector-related selection function • Selection function from Swift minimum detectable peak flux • Intrinsic redshift distribution • Short GRBs • Compact-binary merger scenario • Delay between the creation of compact objects and their final merger τ follows P(τ)=1/τ • Rate of compact-binary mergers at a redshift z calculated by integrating the Star Formation Rate from z back to the past weighted by P(τ) • Long GRBs • Star Formation Rate x fractional mass under some metallicity limit • Duration distribution • By Swift-detected GRBs • This simulation can only constrain the prompt emission from GRBs
Simulation Details • Isotropic Energy distribution • Intrinsic Eiso distribution x detector-specific selection function • Derived effective detection threshold in terms of S/sqrt(t90) from Swift data • Intrinsic Eiso distribution • Power-law with index -1.45 • Universal jet profile model
Fluence distribution of Swift-detected GRBs. Top: Short GRBs, bottom: long GRBs These distributions depend on all the parameters involved in the simulation: Intrinsic Eiso, z, t90 distributions Selection functions: minimum detectable peak-flux, minimum detectable S/sqrt(T90) Excellent agreement between the simulation’s predictions and Swift’s data. Curves with good statistics are the simulation results (top solid, bottom dashed). Verification of the Simulation Swift data Swift data *Swift data: N. Butler et al. ApJ 2007
VHE Emission Model • Simple model on the VHE emission from GRBs: • Not all GRBs have VHE emission • For the GRBs that do have VHE emission: • Isotropic energy emitted in the 1keV-10MeV energy range is proportional to the isotropic energy emitted in the 40GeV-EVHE,max energy range (where X is a cutoff energy – results given versus various EVHE,max). • VHE emission on a power-law – results given versus various spectral indices. • Upper limit set on the proportionality constant R
Upper Limits on the Prompt VHE Emission by GRBs Number of detected GRBs (by this search) versus the ratio R Upper limit on R at the 90% Confidence Level
Upper Limits on the Prompt VHE Emission by GRBs • Upper limits on R (90% CL) versus different spectral indices, maximum emitted energy, and upper metallicity limits. • These results are for the case that all GRBs have VHE emission.
Latest Results • 2007 • Discovery of TeV Gamma-Ray Emission from the Cygnus Region of the Galaxy • Astro-ph: 0611691 – ApJ 658 (2007) L33 • TeV Gamma-Ray Sources from a Survey of the Galactic Plane with Milagro • arXiv:0705.0707 – ApJ 664 (2007) L91 • Milagro Constraints of the Very High Energy Emission from Short Duration Gamma-Ray Bursts • arXiv: 0705.1554 – ApJ 666 (2007) 361 • 2008 • Discovery of Localized Regions of Excess 10-TeV Cosmic Rays • arXiv:0801.3827 • A Measurement of the Spatial Distribution of Diffuse TeV Gamma-Ray Emission from the Galactic Plane with Milagro • arXiv:0805.0417 – Accepted at ApJ • The Large Scale Cosmic-Ray Anisotropy as Observed with Milagro • arXiv:0806.2293 – Submitted to ApJ • In preparation • Results of the triggered and untriggered GRB searches • Search for TeV Pulsation from the Crab and Geminga • Energy Spectra of Selected Gamma-Ray Sources HAWC
HESS Milagro TeV gamma ray TeV -rays: A New Window on the Sky 0.1 GeV Milagro 10 TeV gamma-ray
1/1/2000 1/1/2001 1/1/2002 1/1/2003 1/1/2004 1/1/2005 1/1/2006 1/1/2007 AGNs • HAWC will obtain duty factors and notify multiwavelength observers of flaring AGN in real time. • Milagro has observed 7yr lightcurve of Mrk 421 • HAWC’s increased sensitivity would result in ~10x smaller error bars and have similar error bars on hour time scale rather than 64 days Milagro and XTE ASM 7 yr lightcurve of Mrk 421 (Smith et al. ICRC 2007) ASM Flux cts/s Milagro - Events/day MJD - 50000