Download
1 / 38
380 likes | 492 Views
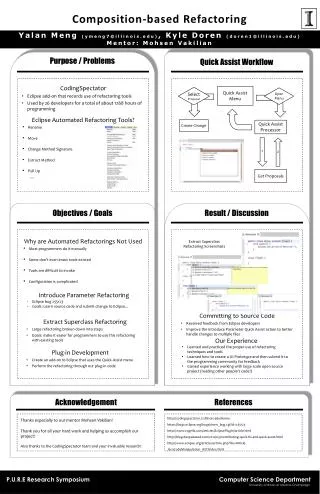
Lithium Related Experiments at University of Illinois. D. N. Ruzic , D. Burns, S. Jung, P. Raman, M. Tung, W. Xu , V. Surla. Presentation Outline. SLiDE (Solid/Liquid Lithium Divertor Experiment) Recent Results Summary and Future Plans IIAX (Ion-Interaction Experiment) Recent Results

E N D
Lithium Related Experiments at University of Illinois D. N. Ruzic, D. Burns, S. Jung, P. Raman, M. Tung, W. Xu, V. Surla
Presentation Outline • SLiDE (Solid/Liquid Lithium Divertor Experiment) • Recent Results • Summary and Future Plans • IIAX (Ion-Interaction Experiment) • Recent Results • Summary and Future Plans • Supporting Experiments • Seebeck Coefficient Experiments • Electrostatic Lithium Dropper • Summary
SLiDE System Overview E-beam source 10cm 25cm Current density profile 10cm 10cm Tray • Solid/Liquid Lithium Divertor Experiment (SLiDE) • Produces temperature gradients with an electron beam • Creates magnetic field with external magnet system (these tests at normal incidence) • Measures temperature distribution in tray containing lithium • Active cooling for steady-state operation • Camera system monitors surface velocity • Designed, constructed and operated for this work
Solid/Liquid Lithium Divertor Experiment (SLiDE) • Lithium is melted in a square stainless steel (SS) tray (10cm*10cm) by a linear electron beam with a Gaussian distribution. • The beam hit the top surface of the Li in a normal direction. The acceleration voltage is 15kV and the beam current ranges from 0 to 100mA. This leads to a input power of 0 to 1.5kW. • Magnetic field is the same direction with the beam. It can reach as high as 800G. • Top surface is monitored by digital camera.
E-beam and thermocouple array • The shape of the beam is affected by the magnetic field. Normally, the width is 1cm and the length is 7cm. • 14 pairs of thermocouples embedded in the tray to gain the temperature distribution at the bottom of the Li based on the 1D heat conduction assumption.
Thermo-Electric MHD driven swirling flow • Left figure shows the thermoelectric effect. Thermoelectric effect requires different material (or TE power), close current return path and temperature gradient. • In the experiment the center of the pool of Li is heated by the beam creating a temperature gradient along the interface of Li and stainless steel tray. This generates the thermoelectric current in the bulk of Li. Under the effect of the magnetic field the Lorentz force will drive the Li to swirl.
Experiment Observation • Swirling flow observed. (TEMHD) • The Thermo-Capillary MHD force (Marangoni Effect) would produce flow away from the heat stripe on both sides • If the magnetic field is turned off, the swirling flow will stop in seconds. • If the beam is shut off while the magnetic field is kept on, the thermoelectric effect will maintain the swirling flow for minutes. • Many confirming experiments done….(field restart, insulating tray, etc. Spin down test
Ratio of TEMHD to TC in SLiDE • All data cases show evidence of swirling flow • TEMHD indirectly shown for Ha>1.4 by temperature • TEMHD directly shown for Ha>17 • TC capable of being seen • Ratio of TEMHD to TC velocity • Ratio = 1 indicates equal effectiveness • Ratio > 1 indicates TEMHD dominance • All data consistent with this formulation “the Jaworski #” M. Jaworski, T.K. Gray, M. Antonelli, J.J. Kim, C.Y. Lau, M.B. Lee, M. J. Neumann, D. N. Ruzic, “Thermoelectric Magnetohydrodynamic Stirring of Liquid Metals”, Phys. Rev. Let., March 2010
Mike Jaworski’s Thesis Results • Appling the torque balance through the body of Li, an equation is built to describe the relation between the peak angular velocity of the Li and the temperature gradient between the interface of Li and stainless steel tray. • The peak angular velocity changes at different Hartmann numbers (Ha=hB(σ/ρν)^1/2) and different C (C=hσ/tσW). • The peak swirling velocity at the top surface is measured and compared to the theory -- they match!
Newer Results: IR camera system • The camera Inframetrics 760 is utilized to measure the surface temperature of the liquid lithium. • Bandpass: 3~12 um • Accuracy: +/- 2 C or +/- 2% • Field of view: 15 degree vertical and 20 degree horizontal • Temperature range: -20 C to 400 C (normal) or 20 C to 1500 C (extended) • Scan rate: 60 Hz • Horizontal resolution: 1.8 mRad, 194 IFOVs/line, 256 Pixels/line • DT-3152 card and software SandIR from Sandia National Lab. Temperature profile can be calculated in the program based on the emissivity map and output as an origin file. Acknowledgements: 1. Dr. DennisYouchinson (SNL) for the SandIR software 2. Dr. Richard Majeski (PPPL) for the ZnSe window
IR calibration and measurement The “emissivity” calibration: • Heat the Li in the chamber to a certain temperature (over 180 C, measured by embedded thermocouple) • Adjust the emissivity value in the control program SandIR, let the measured temperature from the program match the thermocouple value. • Repeat the measurement at different temperature values. • The emissivity is 0.045± 0.005 The IR measurement: • Chose a clean surface and draw a emissivity map • The reflection of the beam can be identified. • Chose a path to measure the temperature distribution along the radius direction. Try to avoid the pass-by impurity layer which looks like a flowing hot spot.
Top surface temperature • The temperature distribution of the top surface is measured at different magnetic field and different beam power. The thickness of Li is 1cm. • Left result is measured at 300W input power while the right result is measured at 400 G. The increase of magnetic field can affect the swirling speed and focus the beam shape. Corresponding to the different input power, the temperature difference across the radius direction is 92.3 0C (150 W), 112.1 0C (300 W) and 167 0C (450 W). • The temperature of the surface that is directly heated by the beam is not significantly higher than other region.
Compared with theoretical result • The surface temperature distribution cannot be calculated analytically. A numerical method is necessary. • The temperature distribution at the interface can be gained through the embedded thermocouple arrays. (300W input power, 265G magnetic field, 1cm Li case) • Based on the theory, the velocity field can be calculated. • Since the top heat flux is known, the temperature distribution through the bulk of Li can be calculated through the 3D steady state heat transfer equation. FLUENT is utilized to calculate the result and the surface temperature distribution is chosen to compare with the IR measurement. • The model result, 13% less in value, shows a similar shape with the IR measurement. Velocity Field Bottom Temperature Top Surface Temperature Top surface temperature comparison
Different thickness of Li • Results of 1cm thick Li and 1.5cm thick Li are compared. For this group of data, magnetic field is 270G and input beam power is 300W. • The temperature results at the interface are almost the same while the flowing velocity of 1 cm Li seems a little bit higher than that of 1.5 cm Li. Thermoelectric effect mainly acts like a force in a thin layer between Li and stainless steel tray. For a thinner layer, it is easier to drive.
Different thickness of Li • Although the temperature at the interface does not change too much, the surface temperature changes a lot. • The temperature profile is higher for 1.5 cm Li. In the swirling flow, the secondary flow in r-z plane is very small compared to the swirling which leads to a low heat transfer rate along the vertical direction. • The slower surface flowing velocity brings up a higher temperature gradient. The center temperature is over 400 0C. • Due to the different surface impurity condition, the temperature measurement for 1.5 cm Li may be higher than the real value. Peak Heat Flux Value in SLiDE for this work: 1 MW/m2 Can do over 10 MW/m2 at higher beam power
Dry-out of the center Dry-out of the center • At a certain magnetic field, if the input beam power is too high, the center of the Li will dry out. At the dry out condition, the tray will be exposed and the temperature of the edge will usually increase quickly to a high temperature. • Since the vapor pressure of lithium above 400 0C may be high for tokamak operation, the dry-out is an important problem for application of free surface Li in tokamak.
Dry-out of the center in SLiDE • In the experiment, a relation between the magnetic field and the input beam power is shown. The magnetic field is set to a value and the input power is increased to the point where the dry-out just appears. • The right side in the graph show the conditions at which dry-out happens in SLiDE. • Thinner Li is easier to dry-out although the surface temperature seems to be lower. • Marangoni effect may be coupled in the flow. The unbalanced surface tension tends to drag the Li from the center while swirling flow may hold the lithium from radius flow. What this means for a liquid metal divertor concept will be part of our “future work”
Newest Work-Molybdenum as tray material • 0.5 mm thick Mo foam on 1mm thick SS plate as bottom plate. The thickness of Li is 1.5 cm, the input power is 300W and the magnetic field is about 400G. • Around 400 0C, Seebeck coefficient of Mo is13 μV/K while that of SS is -3.4 μV/K. Thermoelectric power between Li and Mo is smaller than that of Li and stainless steel which causes a lower TEMHD driven force. • The swirling flow on top of Mo is slower than that on stainless steel even the temperature gradient in Mo/Li case is higher (Future Work).
Future Work- LIMIT Heat flux Hot Li flow Cooling channels Outlet Inlet Passive Li replenishment • Concept for heat removal using TEMHD. The Li flows in the slots of the Mo plate powered by the vertical temperature gradient. This vertical temperature gradient generates vertical current which will be affected by the torroidal magnetic field to drive the Li. This flow will transfer the heat from the strike point to other part. The main part of the Mo plate is cooled to get a stable temperature gradient while the back flow of Li also needs cooling. Cool More details on LIMIT in Ruzic’s talk tomorrow (Friday Morning Session)
20 Ion-Surface InterActioneXperiment (IIAX)
Ion-Surface InterActioneXperiment (IIAX) • Facility to Study Erosion of PFC materials • Past work involved measuring overall erosion rates of plain, and lithium coated ATJ graphite under light ion bombardment. • A new facility was designed and built for chemical erosion measurements Target holder with a UHV heater Plasma cup Li evaporator Gas IN ExB filter LiCl holder QCM Faraday cup Sample holder with UHV heater Plasma cup Li evaporator with shutter
Experimental Set up- Chemical Erosion 22 • Chemical Erosion Measurements • Differential Pumping Arrangement • Residual Gas Analyzer • RF Plasma • Target Heater • Lithium Evaporator
Recent Results - Physical Erosion K. Ibano, V. Surla, and D.N. Ruzic, “Sputtering and Thermal Evaporation Studies of LithiatedATJGraphite”, IEEE transactions on Plasma Science, Vol. 38, No.3, March 2010 Ionization fraction = Y(I)/ Y(T) where Y (T) is total sputter yield given by Y(T) = Y (A) + Y (I) Y (A) is the sputter-yield due to atoms and Y(I) is the sputter-yield due to ions Normally, Y(T) is measured with QCM . By negatively biasing the target, Y(A) is obtained and hence Y(I). Ionization fraction for a 2000 eV Lithium ion beam sputtering of lithiated graphite is found to be 30% ± 6%.
Methodology- Chemical Erosion 24 Experiments are conducted for three different configurations (with and without plasma): • With no target in the main chamber in order to provide a baseline measurement (Contribution from the walls) • With ATJ graphite target in the main chamber to study chemical erosion compounds produced (Walls + Target) • With Li on ATJ graphite to study the effect of lithium treatment on chemical erosion. (Walls + Target) In addition to the above experimental studies, the effect of temperature on chemical erosion of ATJ graphite is investigated by mouting target on a button heater which is controlled by a temprature controller. The ability to bias the target allows energy dependent erosion measurements.
Results - Chemical Erosion 25 mass 28 • Species of Interest – CD4, Mass 28 (CO/C2D2) • Temperature enhances chemical erosion • Li suppresses CD4 but “mass 28” is unaffected • Effect of bias is seen mass 28
Analysis- Chemical Erosion 26 Where Sj Signal at mass, j Mij cracking pattern contribution of species ‘i’ to mass j Pi – partial pressure of species ‘i’ We know Sj, Mij, and we can solve for Pi. Acknowledgements: Dr. J.P. Allain, Dr. M. Neito
Summary and Conclusions • For physical sputtering, Lithium is known to sputter as ions, and the ionization fraction of 30%±6% is obtained for Lithium ion beam sputtering at 2000 eV. • For chemical erosion measurements of carbon, the erosion products with Deuterium plasma are found to be dominated by CD4 and Mass 28. For other products, future work is involved in decoupling radicals to cracking patterns of the RGA. • Chemical erosion increases with temperature. • Lithium treatments on ATJ graphite have shown to suppress the chemical erosion of graphite. Although it is qualitative at this point, CD4 erosion is suppressed by a factor of at least two, while Mass 28 remains the same. • Lithium treatments on ATJ graphite have been shown to be advantageous not only for physical erosion but also for chemical erosion (CD4) and more studies are underway to resolve other species.
Future Plans for IIAX 28 • Chemical erosion studies to continue • Proposed thrust: Study of mixed materials (containing lithium) • Electrostatic analyzer (ESA) • Surface morphology important • Experimental upgrade – XPS in IIAX (allows in-situ determination of the constituents on the surface) • ESA – (allows determining the species coming out of the surface) • Sputtering of Li/W, Li/Mo • Determine metrics and solutions to retain the activity of Li surface
Supporting Experiments 29 Seebeck Coefficient Measurements
30 Apparatus for Seebeck Coefficient DV T + DT T Lithium Extrusion HEATER
31 Seebeck Coefficient of Lithium Typical graph showing the Seebeck Coefficient of Li as a function of temperature
32 Seebeck Coefficient of Lithium The Seebeck coefficient measurements are very sensitive to the coil position
33 Seebeck Coefficient of Lithium-6 Acknowledgements: Dr. Dennis Mansfield (PPPL) for providing Li-6
34 Seebeck Coefficient Measurements • Future Work: • Seebeck coefficient of Sn or other material to verify the apparatus • Seebeck coefficient measurement of lead lithium
Supporting Experiments 35 Lithium Dropper Experiment
Electrostatic Lithium Dropper Concept 36 Concept: A device that can produce a spray of charged lithium droplets (liquid phase), allowing oppositely charged surfaces to be coated evenly with Lithium. Argon Back Pressure The dropper is a hollow stainless steel tube with a very small orifice at the end. The dropper is filled with solid lithium and heated until the lithium melts. As Argon back pressure is applied to the dropper, droplets of molten Lithium will form, with positive charge, and fall from the dropper. The dropper is given a high positive voltage, and the surrounding chamber is given a low positive voltage. The QCM is grounded. The positively charged Lithium droplets are attracted to the grounded QCM, and are there collected and measured. Mass, flowrate, and distance traveled by the Lithium droplets can be measured, determining if a Lithium spray device is feasible. High Voltage Heated Dropper Grounded QCM Charged Li droplets Low Voltage
Lithium Dropper First Result 37 Dropper Orifice: Solid cap with 0.003 mm – diameter hole Test Run: Dropper Temp: 197oC, Argon Bac k Pressure: 40 PSI, Chamber Pressure: 500 mTorr (No bias) (Lithium string length: ~0.5 mm) Dropper w/ Heating Wire Future Orifices: Solid cap with multiple rectangular holes: 0.003 mm x 1 mm (Rectangles seperated by 0.1 mm) QCM String of molten Lithium visibly moving through orifice!
Summary 38 • Several Lithium related experiments are ongoing at CPMI • SLiDE • Successful in studying the flow of liquid lithium (experiment+ theory) • Future Direction • Extensive modelling (to include Dry-out) • Test other substrates relevant to NSTX or LTX • LIMIT concept • IIAX • Erosion Measurements (Physical sputtering, Ionization fractions) • Future Direction • Chemical erosion measurements • Study of Mixed materials containing lithium • Upgrades for surface composition, Li active surface • Need feedback for the DOE renewal proposal