Download
1 / 31
310 likes | 383 Views
Detailed evaluation of food supply chain market structure, concentration, and competition in the EU, including turnover, employment, and enterprise size analysis. Insights from Eurostat data and literature review on food industry dynamics.

E N D
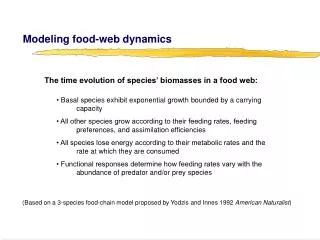
FOODIMAEU Food Industry Dynamics and MethodologicalAdvances Task 1.2 Market structure of the Food Supply Chain in the EU κosτas κaranτininis & Luljeta Hajderllari
In-depth Picture and Evaluation of the Market Structure, Concentration and Competition of the Food Supply Chain in the EU
1.2.1 FOOD industryin the European countries • 1.2.2 Retail marketin the European countries • 1.2.3Specific reportregarding the food industry in Eastern European Countries • The analysis is conducted on the basis of existing information and literature • Deadline: Deliverable 1.2 in month 18 Task 1.2 (Reports)
Size of enterprises in FDT • turnover • employment • Number of enterprises in FDT • Concentration • Lorenc curves • Gini coefficients • Globalization of food processors 1.2.1FOOD industry in the European countries
Turnover in manufacturing Source: Own calculations based on Eurostat SBS
Value added in manufacturing Source: Own calculations based on Eurostat SBS
Employement in manufacturing Source: Own calculations based on Eurostat SBS
Food Industry in Total Source: (Otte Hansen,2005)
Source: Own calculations based on Eurostat SBS Branches of Food Industry
Source: Own calculations based on Eurostat SBS Branches of Food industry
Source: Own calculations based on Eurostat SBS Turnover in meat & dairy
Source: Own calculations based on Eurostat SBS Employement in meat & dairy
Eurostat data 2000-2005 • Turnover and enterprises broken down by size classes for all the EU members • Share of turnover and enterprises • Cumulative percentage • Lorenc curves • Gini coefficients Concentration:Method used
1 to 9 employees, are high in volume but low in value • 10 to 19 employees, high number of enterprises with a very low share in turnover • 20-49 and 50–99, a considerable number of enterprises with a considerable share of turnover • More than1000 employees, a very small share of enterprises and the highest share of turnover Turnover & enterprises broken down by size classes
Source: Own calculations based on Eurostat SBS Lorenz curve 2000-2001
1 to 9 employees are high in volume but low in value • 10 to 19 employees high number of enterprises with a very low share in turnover • 50 to 249 employees, a considerable number of enterprises with a considerable share of turnover • More than1000 employees, a very small share of enterprises and the highest share of turnover Turnover & enterprises broken down by size classes
Source: Own calculations based on Eurostat SBS Lorenz curve 2004-2005
Source: Own calculations based on Eurostat SBS Lorenz curve 2000-2001
0.93 0.89 0.75 Ranking of the EU countries according to Gini coefficients
Ranking of Multinational Enterprise (agri-food focus) by food and drink sales • Total sales toward agrifood sales of MNE • The total number of businesses for leading enterprises is counted in both home and host zones and a globalization index is obtained Globalization of food processors
Source: (CIAA, 2007; Rama, 2005); * 2006 classification of FDT enterprises
Source: (CIAA, 2007; Rama, 2005); * 2006 classification of FDT enterprises Total & agrifood sales of Top 30 FDT (Billion$)
(Muchielli, 1998) a firme can be consideres as : • Ethnocentric MNE (more business activity on their home zones than oversees) • Polycentric MNE (limited number of business activity overseas compare to a large number of business activity on their home zone) • Geocentric MNE (the same number of bussines activities in its home zone as in its host zone) Globalization index of MNE
Coca-cola Company and Lactailsare considered as being geocentric globalized, (from 1988 to 2000 didn’t change anything from its operating strategy in the market) • As we can see from the table major FDT player that can be considered as polycentric multinationals are Uniliver, ConAgra Foods Inc and to a lesser extent Nestle. • The strategy of these giants in the future is to decrease the number of their activities in both host and home zones Globalization index of MNE
Source: ( Rama, 2005); * 2006 classification of FDT enterprises
FDT the second in value added (€ 188 billion),employment (14%), and number of companies (309.7 thousand) after fabricated metal products • Enterprises are small in terms of turnover but large in terms of employment per enterprise • Concentration of turnover in large enterprises is increased • Most of the developed countries are higly concentrated such as Dk,Fr, etc,. • Globalisation is present and is increasing • FDT industry is the largest sector in manufacturing industry in the EU with regard to turnover (€ 850.3 billion) Conclusions
Structure • Conduct • Performance and development • Conclusion and outlook • Data sources available from Eurostat • General Information on Countries (GDP, GVA, EMPetc.) • Structural Business Statistics (SBS) • Short-term business statistics (STS), e.g. Retail Trade Turnover Index • EU-Klems Food industry in the Eastern European Countries
Meeting in Warwick • VERTICAL INTEGRATION • Ref.man (2 case study Hungary and Chzec) • CONTRACTS • Ref.man • COOPERATIVES • Eu dairy & meat cooperatives • Development of cooperatives over the years • Top EU cooperative • RETAIL SECTOR • Overview of the retail formats in the EU countries • Tha Main players in retailing sector • Globalization of retailers • COMPETITIVENESS