Download
1 / 2
20 likes | 110 Views
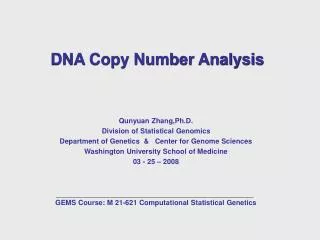
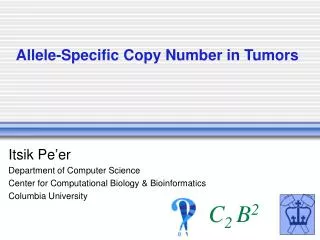
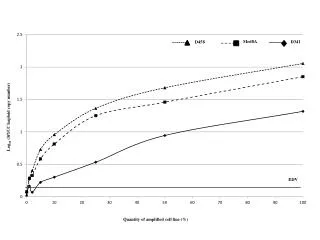
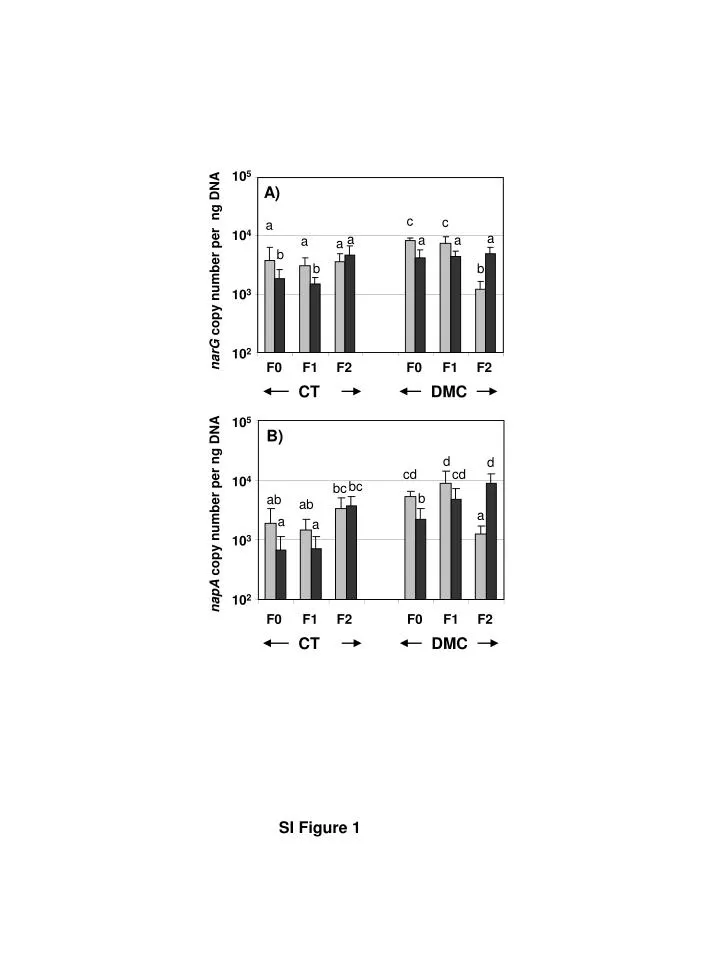
10 5. A). c. c. a. a. a. 10 4. a. a. a. a. b. b. b. narG copy number per ng DNA. 10 3. 10 2. F0. F1. F2. F0. F1. F2. CT. DMC. 10 5. B). d. d. cd. cd. bc. 10 4. bc. b. ab. ab. a. napA copy number per ng DNA. a. a. 10 3. 10 2. F0. F1. F2. F0. F1.

E N D
105 A) c c a a a 104 a a a a b b b narG copy number per ng DNA 103 102 F0 F1 F2 F0 F1 F2 CT DMC 105 B) d d cd cd bc 104 bc b ab ab a napA copy number per ng DNA a a 103 102 F0 F1 F2 F0 F1 F2 CT DMC SI Figure 1
Fig. S1. Size of the nitrate reducer community under direct mulch seeding (DM) and conventional tillage systems (CT) with no fertilization (F0), fertilization with farmyard manure (F1) or fertilization with farmyard manure combined with mineral fertilizer (F2) in 2005 (light grey bars) and 2006 (dark grey bars) estimated by quantitative PCR of the narG (A) and napA genes (B). Bars indicate gene copy numbers expressed per ng of extracted DNA. The same letters above the bars (mean ± standard deviation, n=9) indicate that treatments are not significantly different according to the t-test (P < 0.01).