Download
1 / 38
380 likes | 645 Views
The Housing Health and Safety Rating System . The Healthy Homes Rating System . Interactive tool. https:// drive.google.com/folderview?id=0B8REr4fsWecuRnJBXzYxSzE4cDg&usp=sharing Windows only. Aims of the Session. Learn about the use of the Healthy Homes Rating System in England

E N D
The Housing Health and Safety Rating System The Healthy Homes Rating System
Interactive tool • https://drive.google.com/folderview?id=0B8REr4fsWecuRnJBXzYxSzE4cDg&usp=sharing • Windows only
Aims of the Session • Learn about the use of the Healthy Homes Rating System in England • Focus on health impacts from housing and their relevance from an English perspective • See two software tools • Interactive house • Health Cost Calculator
Aims of the Session • Learn about the use of the Healthy Homes Rating System in England • Focus on health impacts from housing and their relevance from an English perspective • See two software tools • Interactive house • Health Cost Calculator
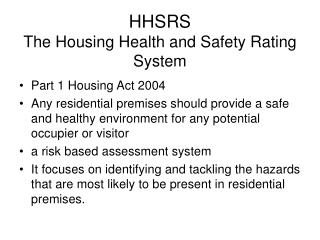
Principle behind rating system A dwelling, including the structure and associated outbuildings and garden, yard and/or other amenity space, should provide a safe and healthy environment for the occupants and any visitors.
What is it...? • It’s how we evaluate potential risks to health and safety that may arise from deficiencies in a dwelling • It looks at: • Likelihood of harm • Probable severity of that harm • It assesses 29 different hazards • Comfort does not matter!
Categories of hazard • Physiological requirements • e.g. damp and mould growth, excess cold, excess heat, carbon monoxide, lead, VOC’s • Psychological requirements • e.g. entry by intruders, lighting, noise • Protection against infection • e.g. food safety, sanitation • Protection against accidents • e.g. falls, fire, structural collapse
Damp and mould growth Excess cold Excess heat Asbestos (and MMF) Biocides CO and combustion products Lead Radiation Uncombusted fuel gas VOCs Crowding and space Entry by intruders Lighting Noise Domestic hygiene, pests and refuse Food safety Personal hygiene, sanitation and drainage Water supply Falls associated with baths Falling on level surfaces etc. Falling on stairs etc. Falling between levels Electrical hazards Fire Flames, hot surfaces, etc. Collision and entrapment Explosions Position and operability of amenities Structural collapse and falling elements All The Hazards
Hazard profiles For each hazard: • Definition is offered • Potential for harm is identified • Vulnerable groups are identified • The ‘ideal’ is identified • Relevant features are described • Guidance is developed
Health outcomes Four classes of harm identified • Class 1 – extreme • Class 2 – severe • Class 3 – serious • Class 4 - moderate
Class 1 Examples include: • Death from any cause; • Lung cancer; • Mesothelioma and other malignant lung tumours; • Permanent paralysis below the neck; • Regular severe pneumonia; • Permanent loss of • consciousness; • 80% burn injuries.
Class 2 • Cardio-respiratory disease; • Asthma; • Non-malignant respiratory diseases; • Lead poisoning; • Anaphylactic shock; • Crytosporidiosis; • Legionnaires disease; • Myocardial infarction; • Mild stroke; • Chronic confusion; • Regular severe fever; • Loss of a hand or foot; • Serious fractures; • Serious burns; • Loss of consciousness for days
Class 3 – serious harm outcomes • Eye disorders; • Rhinitis; • Hypertension; • Sleep disturbance; • Neuro-pyschologicalimpairment; • Sick building syndrome; • Regular and persistent dermatitis, including contact dermatitis; • Allergy; • Gastro-enteritis; • Diarrhoea; Vomiting; • Chronic severe stress; • Mild heart attack; • Malignant but treatable skin cancer; • Loss of a finger; • Fractured skull and severe concussion; • Serious puncture wounds to head or body; • Severe burns to hands; • Serious strain or sprain injuries; • Regular and severe migraine.
Class 4 • Regular serious colds or coughs • Pleural plaques; • Occasional severe discomfort; • Benign tumours; • Occasional mild pneumonia; • Broken finger; • Slight concussion; • Moderate cuts to face or body; • Severe bruising to body; • Regular serious coughs or colds.
Linking deficiencies to hazards • Once identified, deficiencies must be allocated to a hazard • A deficiency may contribute to more than one hazard • Several deficiencies may contribute to one hazard
Deficiencies to Hazards • It is the cumulative contribution of the deficiencies to the hazard that should be assessed • It is a whole dwelling assessment for each hazard • Assumes the ‘at risk group’ inhabit the property
BOX 1 Similar Hazards, with Differing Outcomes Example – There is a window with a low internal sill (about 250mm above the floor). A small child could climb onto the sill and open the window relatively easily and could fall out through the open window. The likelihood of this occurring over the next twelve months is judged to be around 1 in 180. If that window is on the ground floor with grass immediately below, the outcome would be relatively minor – 99% Class IV (bruising) and perhaps 1% Class III (a strain or sprain). This would give a Hazard Score of 7 (Band J). However, if that same window is on the 2nd floor with a paved area immediately below, the outcome would be major – 10% Class I (paralysis or even death), 80% Class II (serious fractures) and 10% Class III (a strain or sprain). This would give a Hazard Score of 1,016 (Band C). Although in both cases the likelihood is the same, the Hazard Score reflects the dramatically different outcome.
Housing Act 2004 • HHSRS (HHRS) is enshrined in legislation • England and Wales assessment system for all housing • Stock condition surveys • Decent Homes Standard
Issues with UK housing • Excess cold • Falls on stairs • Falls on the level • Falls between levels • Fire, damp and mould, hot surfaces, radon, pests • Overcrowding, electrical, CO, sanitation, noise
Increasing awareness • Attitudes • Ignorance • Political will • Prevention vs cure • Old housing • Fuel poverty
Interactive tool • https://drive.google.com/folderview?id=0B8REr4fsWecuRnJBXzYxSzE4cDg&usp=sharing • Windows only
Quantifying improvements and justifying your work • Hard to measure something that has not occurred • Justify expense of interventions • Interventions can vary in cost considerably
Quantifies poor housing • Providing a tool for policy • Funded by BRE Trust and carried out by BRE in partnership with the Universities of Warwick and Brighton
Costs to society of living with HHSRS hazards (adapted from BRE, n.d.)
Typical Healthy Homes Rating System outcomes and 1st year treatment costs (40% of total costs) (BRE, n.d.)
Health Cost Calculator • Building Research Establishment & RHE ‘The Trust commissions research into the challenges faced by the built environment and publishes project findings which act as authoritative guidance to the construction industry’ (BRE, 2014) • Uses direct costs of medical treatment and aftercare (<1yr) • Robust data • Probably accounts for 40% of total costs
Health Cost Calculator • Uses reduction in probability of category 1 hazardous event and severity of outcomes • Provides projected savings on healthcare costs based on NPV calculations • Gives account of costs vs savings • Payback period • Cumulative record for area based work
How it all works Expected Cost to NHS (£) HAZARD - Work Cost of work (£) Expected Cost to NHS (£) HAZARD Mitigated = / Saving (£) = Payback period
Example • Cost to fit banister £400/$669 • Annual savings on healthcare £146/244 • Payback 2.7 years
Savings from five officers working across a 460,000 person city (courtesy of Bristol CC)
Cases can be added one by one • You can identify dwellings by address, UPRN or both • HHRS system uses representative scale points • NHS costs and costs to society appear at the bottom of the screen
Henry Dawson hdawson@cardiffmet.ac.uk Thank you for listening