Download
1 / 40
400 likes | 538 Views
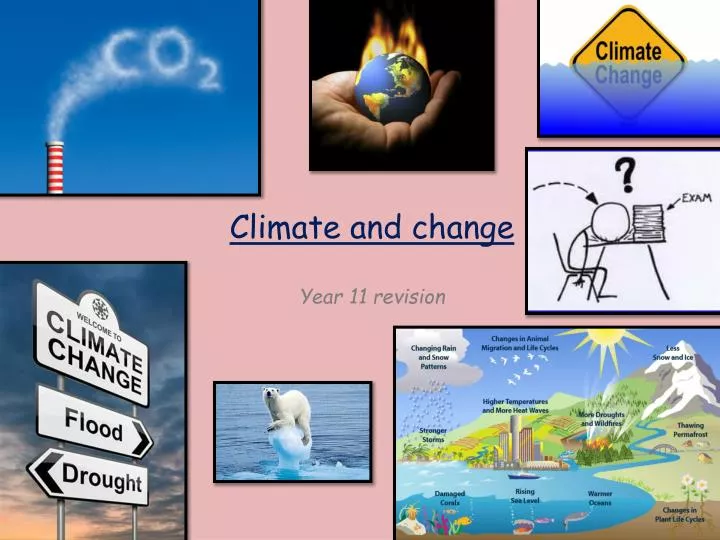
Climate and change Year 11 revision. Key terms. Key terms. Key terms. You must be familiar with reading climate graphs ...practise!. Key facts: Climate graphs. Read rainfall scale from here. Read temperature scale from here. Plymouth, UK. o C. mm. Name months!.

E N D
You must be familiar with reading climate graphs...practise! Key facts: Climate graphs Read rainfall scale from here Read temperaturescale from here Plymouth, UK oC mm Name months!
Key facts: The UK climate Scotland Wales England
Key facts: The UK climate What controls the UK climate? A lot to do with ‘air masses’. Air masses are huge blocks of air. They can be damp or dry, warm or cold, depending on where they came from and over what type of surface they have travelled. For example, an air mass that has travelled over the sea will increase its moisture content and be more likely to produce rainy weather.
Key facts: Past temperatures have always fluctuated Climate has changed in the past through natural causes on timescales ranging from hundreds to millions of years.
Key facts: Recording past climate • How do we know climate was different in the past? • Fossils of animals and plants that no longer live in the UK. • Landforms left by glaciers • Samples from ice sheets in Antarctica. Ice sheets are made up of layers of ice, a layer for each year. Trapped in the ice sheets are air bubbles. Climatologists study the CO2 levels to reconstruct past climates. • How do we know climate has changed in the more recent past? • Old photos, paintings • Diaries • Newspapers • Recorded dates of blossom and migration of birds.
Impact of past climate change • ‘Little Ice Age’ • A period of significant cooling 300 years ago • It had a negative impact on agriculture (farming), people & ecosystems.
Impact of the ‘Little Ice Age’: On people and the environment
Impact of past climate change .....Focus on agriculture. • Western Europe experienced a general cooling of theclimate between 1150-1460 and a very cold climate between 1560-1850. • During the coldest times, England's growing season was shortened by 1-2 months compared to today. • Unlike seeds today, back then the seeds could not survive the extreme cold or warmth, wetness or dryness. • Price of wheat went up dramatically as it became more difficult to grow and get hold of. Climate changes had a much greater impact on agricultural output in the past. • One of the worst famines in the seventeenth century occurred in France due to the failed harvest of 1693. Millions of people in France and surrounding countries were killed. • In Norway, many farms located at higher latitudes were abandoned for better land in the valleys.
How were ecosystems affected by climate change in the past? • The dinosaur extinction was possibly caused by a massive asteroid hitting Mexico and a huge volcano in India combining: dust, ash, gas go up into the stratosphere which blocks the sun out which cools the climate so plants don’t grow so dinosaurs have no food… • …which has a knock on effect through the food chain. Megafauna extinction – big animals like the woolly mammoth and sabre-toothed tiger. The climate was warming so they had to find new areas to live where the climate suited them. This disrupted food chains. Humans also hunted them to extinction.
Mega fauna extinction This caused temperatures to rise, ice to melt and glaciers to retreat. The retreating glaciers meant there was less water available for the plants & animals. The ice age (Pleistocene) period finished around 10,000 years ago. The lack of herbivores meant carnivorous animals began to die as they had less prey. The lack of plants meant herbivores (vegetarian) animals began to die. The lack of water & rise in temperature meant lots of plants died as they could not adapt. The overall change in climate caused a big change in the food chain, which meant many animals became extinct. Other theories suggest some animals became extinct because they were hunted by humans.
Climate change and humans The main greenhouse gasses
Greenhouse gasses and temperature “Describe the graph” 1880: Global temperature = -0.4oF Carbon Dioxide = 300ppm Fluctuating, but general increase of both global temperature and CO2 between 1880-1940. Then a much faster rate of growth for both factors, until: 2000: Global temperature = 1oF Carbon Dioxide = 380ppm There is a direct link between the amount of carbon dioxide in the atmosphere and temperature.
How Does the Greenhouse Effect Work? • Greenhouse gases (CO2 from the burning of fossil fuels, deforestation, Methane from paddy fields etc....) trap heat from leaving the atmosphere and re-radiate that heat back down to earth. • The greater the concentration of greenhouse gases, the more heat is trapped and the warmer earth becomes. • We need the NATURAL greenhouse effect – it makes the planet 16 degrees warmer. Without it the earth would be too cold for us to survive. • The extra greenhouse gases produces by humans burning fossil fuels power stations, transport, industry, homes.
Greenhouse gases: Change over time • Since pre-industrial times, atmospheric concentrations of greenhouse gases have grown significantly: • countries become more industrialised • people become consumers of energy and goods • Become bigger producers of air pollution (through the burning of fossil fuels) Most greenhouse gases are produced by developed countries – the EU, USA, Japan.
Greenhouse gases: Change over time • The USA produce the largest amounts of CO2each year. • The world’s current level of CO2is increasing at a rate of 200x faster than at any time in the past million years. • Rates of methane have also doubled since the 1800s due to the growing world’s population demanding an increasing amount of cows for meat. • Emerging powers such as China and India are now in line with older polluters such as USA and Europe due to the take off of their development. • China is now the world’s largest single polluter.
World C02 emissions: Highest C02 emissions = North America, Europe, Japan, UAE, China (predominantly MEDCs and NICs) Lowest C02 emissions = South America, Africa, Russia (predominantly LEDCs)
World C02 emissions: • China emits more CO2 than the US and Canada put together - up by 171% since the year 2000. • India is now the world's third biggest emitter of CO2- pushing Russia into fourth place. • The biggest decrease from 2008-2009 is Ukraine - down 28% in recent years. The biggest increase is the Cook Islands - up 66.7% since 2000. • But that is only one way to look at the data - and it doesn't take account how many people live in each country. If you look at per capita emissions, a different picture emerges where: • Some of the world's smallest countries and islands emit the most per person - the highest being Gibraltar with 152 tonnes per person. • The US is still number one in terms of per capita emissions among the big economies - with 18 tonnes emitted per person. • China, by contrast, emits under six tonnes per person, India only 1.3 • For comparison, the whole world emits 4.49 tonnes per person (average).
World C02 emissions: Reasons for variations in global emissions
Effects on people Effects of the environment
Case studies! Climate change will have positive & negative impacts on people, the environment and countries economies. Developing countries will be affected more negatively than developed countries.
How might a developed country be affected by climate change? • UK(MEDC)
Warmer How might a developed country be affected by climate change? Sea-level rise More extreme weather
Future UK climate • Overall UK summers and winters will be warmer. • Temperature on average will rise by 4°C by 2080. • In the summer heat waves will be become more common as temperatures reach 40°C • Rainfall in the summer is expected to decrease and as a result we will suffer from more droughts. • Winters will bring less snow and more rain. • We will also receive more severe storms.
How might a developing country be affected by climate change? • A developing country • Low greenhouse gas emissions – 2.6 tonnes per person per year (world average = 6.8) • Produce less than 1% all green house gases. • 99% of Egypt’s people live in 5% land area as so much is desert. • Average rainfall = less than 10mm/yr • The River Nile is an important water supply.
How might a developing country be affected by climate change? • With Global Warming… • If sea levels rise 50cm, 1/3 of the city of Alexandria would be under water. • 10% Nile Delta would flood 7 million people would have to leave their homes farming would be hit there would be less food famine. • Less and more unreliable rainfall water shortages. • Desertification • Heat waves illness and death. • Malaria increase. • Water Wars? • 86% of the Nile’s water starts it’s journey in Ethiopia. • Uganda, Sudan and Ethiopia are all building huge dams for Hydro Electric Power (HEP). • This could have a serious impact on the amount of water reaching Egypt This could lead to conflict and war. • Egypt has a debt of $30 billion. It may not be able to cope with the impacts of global warming.
Video revision: • What are air masses? • Antarctic Ice reveals Climate History • Dinosaurs Extinction • Evidence for global warming - polar ice caps • Climate change dangers • Global Warming - None Like It Hot! • BBC climate experiment • Climate Change and the future of weather • Egypt struggles with climate change
Past GCSE questions: A • Outline one reason why sea level is expected to rise in the future (2 marks) • Describe two impact of melting ice sheets on the environment (2 marks) • Describe one impact of a short term past climate change ona) People b) the environment (4 marks) • Explain how natural events can cause climate change. (4 marks) • Describe two natural cause of climate change. (4 marks) • Explain how human activity is leading to climate change. (4 marks)
Past GCSE questions: B Describe how two human activities can contribute to climate change. (2 marks) Give two reasons why developing countries often produce less carbon dioxide than developed countries (2 marks) Explain the possible economic(money) impacts of climate change on a named country. (4 marks) Describe one way in which climate change might make people poorer (2 marks) For a named developing country, explain why climate change is likely to have a large impact on its people. (6 marks)
Past GCSE questions: C • For a named developing country, explain how climate change is likely to have a large impact on its economy. (6 marks) • For a named country, suggest one possible impact of higher global temperatures. (2 marks) • State two possible impacts of climate change in the UK (2 marks) • Explain how the future climate of the UK is likely to be affected by global climate change (6 marks) • Describe how climate change in the past, such as the Little Ice Age, affected people and ecosystems. (4marks). • Describe how colder periods, such as the Little Ice Age, affected farming. (2 marks)