Download
1 / 3
30 likes | 98 Views
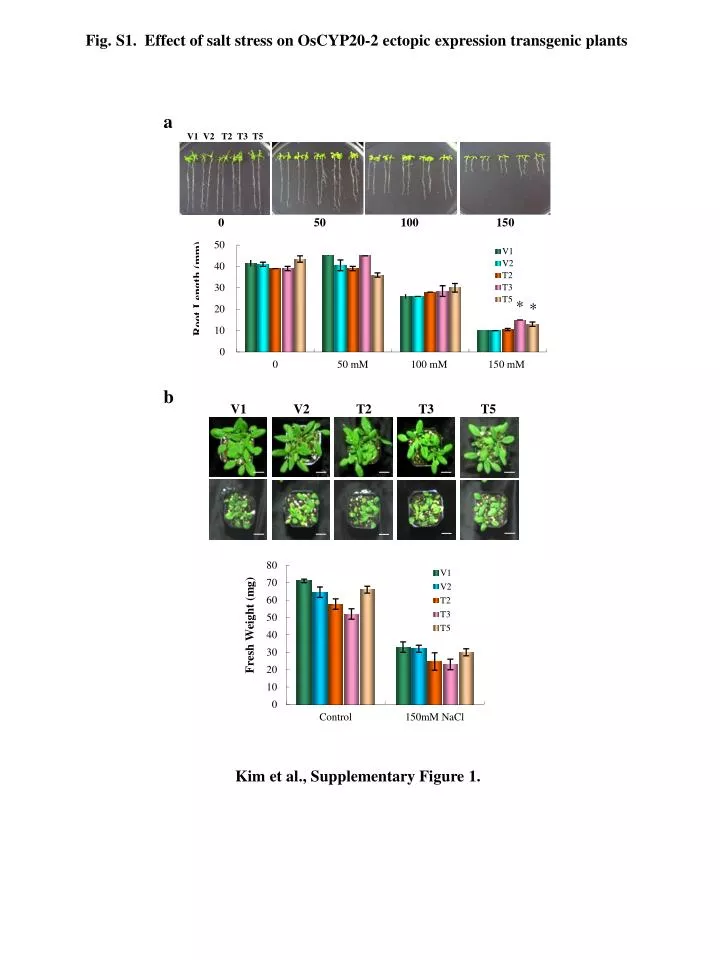
Fig. S1. Effect of salt stress on OsCYP20-2 ectopic expression transgenic plants. a. *. *. *. *. V1 V2 T2 T3 T5. b. 0 50 100 150. V1 V2 T2 T3 T5.

E N D
Fig. S1. Effect of salt stress on OsCYP20-2 ectopic expression transgenic plants a * * * * V1 V2 T2 T3 T5 b 0 50 100 150 V1 V2 T2 T3 T5 Kim et al., Supplementary Figure 1.
Fig. S2. Analysis of NDH complex on BN-PAGE in normal and drought stress conditions b a Normal Drought N D V2 T2 T3 T5 V2 T2 T3 T5 → I → I PSII -S PSII-S PSII-D PSII-D PSII-M CP43 less-PSII PSII-M CP43 less-PSII LHCII -T LHCII -T LHCII-M Kim et al., Supplementary Figure 2.
Fig. S3. Ectopic expressed OsCYP20-2 Arabidopsis represents growth promotion V1 V2 T2 T3 T5 Kim et al., Supplementary Figure 3.