Download
1 / 8
80 likes | 172 Views
Unit 1 Practitioner’s Work. http://davidmlane.com/hyperstat/outlier.jpg. Unit 1 Scenario 1 . Complete the course pretest. No need to study, just take the test.

E N D
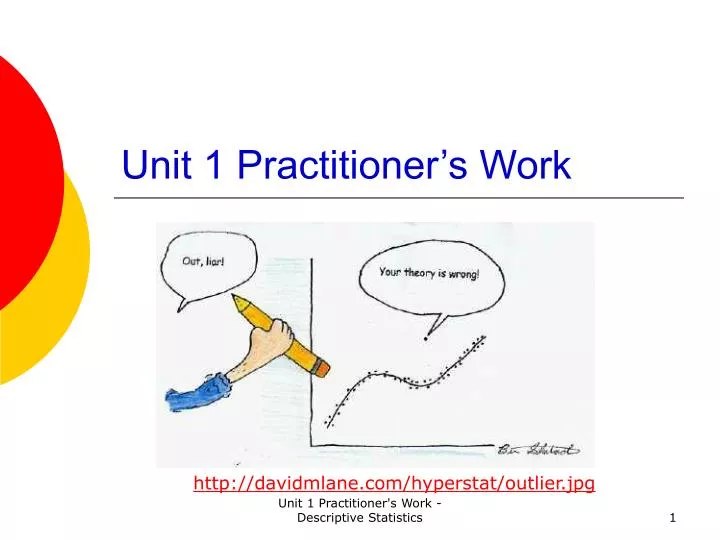
Unit 1 Practitioner’s Work http://davidmlane.com/hyperstat/outlier.jpg Unit 1 Practitioner's Work - Descriptive Statistics
Unit 1 Scenario 1 • Complete the course pretest. No need to study, just take the test. • Descriptive statistics. Kerlinger & Lee discuss beginning p. 202. For example, to calculate a mean:http://www.openepi.com/Menu/OpenEpiMenu.htm • After some students took the pretest in one class, eCollege calculated descriptive statistics about the test. Unit 1 Practitioner's Work - Descriptive Statistics
Descriptive statistics • Descriptive statistics give us information that helps us interpret the data. • In this case, we are not comparing this test with another test or this group with another group, we are just describing the behavior of this group (you). • Voila, descriptive statistics. http://members.pioneer.net/~mchumor/00images/7203_statistics_cartoon.gif Unit 1 Practitioner's Work - Descriptive Statistics
15 14 13, 13, 13, 13 12 11 Mean? Median? Mode? Range? Scores http://www.sarkisian.net/sc705/book.jpg Unit 1 Practitioner's Work - Descriptive Statistics
Descriptive Statistics • Highest Score: 15 (83%) • Lowest Score: 11 (61%) • Range: 4 (Lowest to highest score.) • Mean: 13 pts. (Average) • Median: 13 pts. (Midpoint)Mode: 13 pts. • Number of Respondents: 8 • Points Possible: 18 pts. Unit 1 Practitioner's Work - Descriptive Statistics
Imagine that we had 100 students take this pretest. • A bunch of scores might fall in the middle, with very few scores at very high and very low 9-10 or 1-2. • This creates a bell curve effect (see attachment). http://www.ahrq.gov/about/annualmtg07/0926slides/middleton/Middleton-23.jpg Unit 1 Practitioner's Work - Descriptive Statistics
The SD deviation describes what the data looks like. • M = mean or average. S or SD -1 would be one standard deviation below the mean, +1 would be one standard deviation above the mean, and so on. Unit 1 Practitioner's Work - Descriptive Statistics
End Thanks for taking the time to review this information! http://fc.bullis.org/~faith_Darling/FOV2-0001D744/S01105998-01105998.0/PieChartCartoon.gif Unit 1 Practitioner's Work - Descriptive Statistics