Download
1 / 11
110 likes | 202 Views
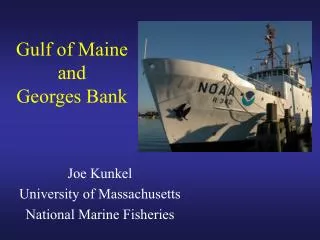
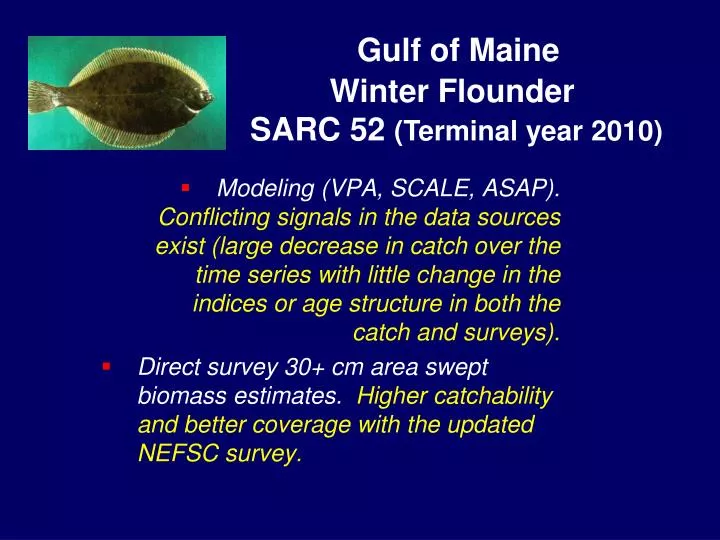
Gulf of Maine Winter Flounder SARC 52 (Terminal year 2010). Modeling (VPA, SCALE, ASAP). Conflicting signals in the data sources exist (large decrease in catch over the time series with little change in the indices or age structure in both the catch and surveys).

E N D
Gulf of Maine Winter Flounder SARC 52 (Terminal year 2010) • Modeling (VPA, SCALE, ASAP).Conflicting signals in the data sources exist (large decrease in catch over the time series with little change in the indices or age structure in both the catch and surveys). • Direct survey 30+ cm area swept biomass estimates. Higher catchability and better coverage with the updated NEFSC survey.
Exploitable Biomass = 30cm+ biomass index per tow /1000 x total survey Area/tow footprint x 1/q Q = 0.6 Exploitation rate = catch / 30cm+ biomass.
Combined Surveys 30+ Biomass Estimate
The Plan • Update catch (MRIP Ab1 + b2 2004-2013, commercial landing, lg mesh trawl discards, gillnet discards, shrimp discards). • Converted survey indices for trends (NEFSC, MDMF, MENH). • Updated 30+ area swept biomass for each component (NEFSC, MDMF, MEHH) • Estimate uncertainty with Dr. Rago’s code
Length based YPR m=0.3 FMSY = F40% = 0.31 Exploitation rate = 0.23 Knife edge selectivity at 30 cm
The Issue Catch is very low (in the 300 mt range over the last few years, ABCs set at 1050 mt). Stock biomass does not seem to respond to the very low catches. There are signs of declining biomass in the surveys.
Possible use of GB yellowtail assessment logic? Little information on the Q assumption. There are questions with herding and footrope escapement in the surveys. The GB yellowtail benchmark borrowed from flatfish literature estimates (0.37 on the doors). Assuming 0.37 is similar to assuming 1.0 on the wings. Should or can this logic be used in this assessment or do we rely on GB winter flounder Q inferences?
Question 2 Do we use the Fall 2013 estimate or can we consider using the Spring estimates? The logic to use the Fall survey makes biological sense but recent Spring estimates are higher.