Download
1 / 39
460 likes | 728 Views
Introduction to Proteomics CSC8309 - Gene Expression and Proteomics. Simon Cockell Bioinformatics Support Unit Feb 2008. Outline. Introduction Why proteomics? Sample Collection Separation Techniques Gels Columns Mass Spectrometry Ionisation Mass Analysis Protein Identification.

E N D
Introduction to ProteomicsCSC8309 - Gene Expression and Proteomics Simon Cockell Bioinformatics Support Unit Feb 2008
Outline • Introduction • Why proteomics? • Sample Collection • Separation Techniques • Gels • Columns • Mass Spectrometry • Ionisation • Mass Analysis • Protein Identification
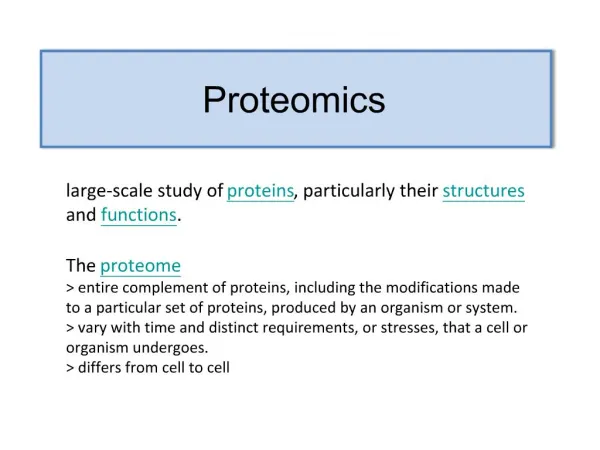
The proteome • Organisms have one genome • But multiple proteomes • Proteomics is the study of the full complement of proteins at a given time
Why proteomics? • Microarrays are easier, and more established • So why use proteomics at all? • It is proteins, not genes or mRNA, that are the functional agents of the genome • Transcriptome information is only loosely related to protein levels • Abundant transcripts might be poorly translated, or quickly degraded
Basic principles • 3 steps to most proteomics experiments • Preparation of a complex protein mixture • Separation of protein mixture • Charaterisation of proteins within mixture
Sample Collection • Controlled conditions • Low-salt (for later Mass Spec) • Prevention of: • Contamination • Degredation • Consider difficult to purify proteins • e.g. membrane-bound
Separation Techniques2D-GE - Isoelectric Focusing • Separation of proteins on basis of isoelectric point • Proteins migrate through pH gradient until their overall charge is neutral • IEF strip soaked in buffer to impart large negative charge to all proteins (for next step)
Separation Techniques2D-GE - Polyacrylamide Gel Electrophoresis • Separation of proteins on basis of size • Small proteins migrate through gel matrix quickest • Resulting gel has proteins separated • Horizontally by IEP • Vertically by size
Separation Techniques2D-GE - Staining • Proteins visualised by staining with dyes or metals • Different dyes have different properties • Silver stain • Coomassie • Fluorescent
Separation Techniques2D-GE - Staining 1ng 10ng 100ng 1000ng
Separation Techniques2D Gel Electrophoresis • Limitations • Resolution • Representation • Sensitivity • Reproducibility • Advantages • Established technology • Still improving • Quick • Cheap (relatively)
Separation TechniquesDIGE • DIfference Gel Electrophoresis • Variation of standard 2D-GE • Multiple samples on one gel • Usually 2 samples & pooled reference • Differentially labelled • Eliminates running differences between gels
Separation Techniques2D-GE Analysis • Gel to Gel comparison identifies varying protein spots • Images overlaid and examined for differences • Relies on: • Image warping • Spot matching • Quantitative spot volumes
Separation Techniques2D-GE Analysis • Progenesis SameSpots (Nonlinear Dynamics) • DeCyder (GE Healthcare) • Delta2D (DeCodon GmBH)
Separation TechniquesLiquid Chromatography • Proteins washed through capillary column (or columns) • Separates based on specific properties • Charge • Size • Hydrophobicity • Depends on column matrix/eluent
Separation TechniquesLiquid Chromatography • Usually 2 (or more) columns used (MDLC) • Can be coupled to Mass Spec (online) • Or fractions collected for later analysis (offline) • Example: MudPIT (Multidimensional Protein Identification Technology)
Separation TechniquesLiquid Chromatography • Limitations • No Peptide Mass Fingerprint • Protein ID by MS/MS • Expensive • Difficult • Advantages • Resolution • Representation • Sensitivity • Reproducibility
Reporter Moiety Balancer Moiety Separation TechniquesiTRAQ Sample 1 digest Sample 2 digest • Protein samples digested and labelled • Labels have different MW reporters • Differently labelled peptides elute from column together • MS/MS allows relative abundance of 2 reporters to be calculated + Tag + Tag N-hydroxy succinimide ester for reaction with primary amines (e.g. N-terminus of peptides) Total m/z of tag - 145 116 114 Calculate abundance of released reporter moiety
Mass SpectrometryThe Basics • Analytical technique that measures Mass:Charge ratio (m/z) of ions • Mass Spectrometers consist of 3 parts: • An ion source • A mass analyzer • A detector system • Only certain types of Mass Spec are used in proteomics • MALDI, SELDI or Electrospray ion sources • Time of Flight, Quadrupole or Fourier Transform mass analyzers • Can Mass Spec whole proteins, but usually just peptides
Mass SpectrometryIonisation - MALDI • Matrix Assisted Laser Desorption/Ionisation • Sample is mixed with matrix and allowed to crystallise on a plate • Laser fired at matrix (~100x) produces ions • Typical matrix: • 3,5-dimethoxy-4-hydroxycinnamic acid (sinapinic acid) • α-cyano-4-hydroxycinnamic acid (alpha-cyano or alpha-matrix) • 2,5-dihydroxybenzoic acid (DHB).
Mass SpectrometryIonisation - Electrospray (ESI) • Sample in volatile solvent • Introduced to highly charged needle • Forces charged droplets from needle • Solvent evaporation leaves only charged sample
Mass SpectrometryMass Analysis - Time of Flight • Ions mobilised by high voltage • Travel through flight tube • Deflected by reflectron (an ‘ion mirror’) • Increases the path length (often doubles it) • Therefore increases the resolution • Time taken to reach detector is directly proportional to mass of the analyte
Mass SpectrometryMass Analysis - Quadrupole • 2 different charges applied to 2 pairs of metal rods • Ions travel down the quadrupole between the rods • Only ions of a certain m/z will be able to travel between the rods for a given charge ratio • Other ions will collide with the rods • Spectrum produced by scanning voltages
Mass SpectrometryMass Analysis - Fourier Transform • Fourier transform ion cyclotron resonance • Determines m/z based on cyclotron frequency of ions in a fixed magnetic field • Ions do not hit the detector, but are sensed as they pass close to it • Produces a frequency spectrum • A Fourier Transform procedure produces the mass spectrum from this
Mass SpectrometryTandem MS • Multiple mass analysis steps • Separated by fragmentation • Multiple methods of fragmenting • collision-induced dissociation (CID) • electron capture dissociation (ECD) • electron transfer dissociation (ETD) • chemically assisted fragmentation (CAF)
Protein IdentificationPeptide Mass Fingerprinting • Proteases cut at defined sites • e.g. trypsin cuts C-terminal of K or R • Proteins cut with an enzyme will give a series of peptides of different masses • Different proteins will give different series of peptides • This is the peptide mass fingerprint of a protein
Protein IdentificationPeptide Mass Fingerprinting • Alcohol dehydrogenase (374aa, human) gives 26 peptides greater than 500 Da • 5795.795, 2861.4138, 2836.509, 2294.2069, 1685.9261, 1649.8493, 1645.8076, 1583.8315, 1557.7804, 1277.6228, 1181.7404, 1001.4833, 955.4731, 944.52, 920.5451, 889.4737, 885.5404, 846.4866, 827.4257, 780.4072, 695.2599, 648.3311, 622.3229, 580.3341, 573.2878, 564.281, 548.2787 • Guanine Nucleotide-Binding Protein, alpha-15 (374aa human) gives 31 peptides greater than 500 Da • 3856.7945, 2092.0498, 1890.9748, 1864.0254, 1826.9734, 1769.8275, 1717.7924, 1690.8646, 1512.7263, 1360.6491, 1343.5606, 1326.5163, 1301.7212, 1295.6353, 1121.6565, 1083.6408, 1058.5339, 992.5299, 950.4434, 873.4424, 847.4407, 815.4621, 743.4661, 732.3522, 724.3876, 701.3253, 662.362, 660.3675, 595.345, 531.2885, 503.2936 • If you look at the two lists of peptide masses you will not see any matches
Protein IdentificationPeptide Mass Fingerprinting • Alcohol dehydrogenase 7 (374 aa, human) gives 26 peptides greater than 500 Da • 5795.795, 2861.4138, 2836.509, 2294.2069, 1685.9261, 1649.8493, 1645.8076, 1583.8315, 1557.7804, 1277.6228, 1181.7404, 1001.4833, 955.4731, 944.52, 920.5451, 889.4737, 885.5404, 846.4866, 827.4257, 780.4072, 695.2599, 648.3311, 622.3229, 580.3341, 573.2878, 564.281, 548.2787 • Alcohol dehydrogenase beta2 (375 aa, human) gives 25 peptides greater than 500 Da • 4256.1078, 2846.4471, 2211.097, 1945.951, 1758.8003, 1729.9523, 1580.7261, 1555.8366, 1329.6797, 1202.6602, 1067.4826, 954.5982, 943.5094, 915.5298, 894.4753, 885.5404, 847.4268, 798.4144, 785.39, 637.3304, 594.2916, 580.3341, 543.3137, 526.2442, 516.2888 • Two closely related protein and yet only two peptides match
Protein IdentificationPeptide Mass Fingerprinting 699.45544, 896.32411, 909.51544, 909.75215, 912.58639, 920.50129, 973.56255, 1120.58328, 1127.71575, 1193.71203, 1508.56263, 1524.83725, 1525.14491, 1581.85175, 1718.0056, 1721.99879, 1979.20465, 2161.18785, 2184.04418, 2185.00575, 2201.3252, 2514.47913, 3354.92129, 3358.93766 Deisotoping and Noise Reduction Database Search Extract Peak List Results
Protein IdentificationMS/MS • Peptides fragment in a predictable way • From an MS/MS spectrum, you can work out the peptide sequence • A peptide of >7 amino acids should be sufficient to uniquely identify a protein
Protein IdentificationMS/MS Parent ion m/z = 1522.64 Daughter ion spectra can be deconvoluted to give sequence. The major PMF search engines can also achieve protein ID by MS/MS (MASCOT, SEAQUEST etc).
Role of Bioinformatics • Software packages for image analysis are complicated • A large part of my job is training lab biologists to use them • Now moving into LC/MS analysis too • Downstream analysis of experiments • Similar in many ways to microarrays • Visualisation of results can aid understanding • Data standards • MIAPE, PSI, HUPO… more about this later
Summary • Most proteomics experiments have same skeleton • Purification, Separation, Identification • Many different technologies • 2DGE, LC, MALDI, SELDI, TOF, FT etc • Importance of bioinformatics increasing
Any questions? After the fact questions: s.j.cockell@ncl.ac.uk