Download
1 / 45
450 likes | 589 Views
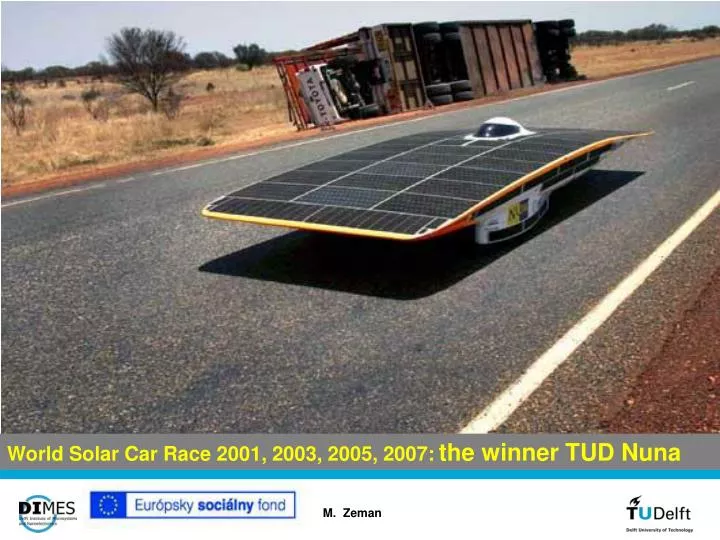
World Solar Car Race 2001, 2003, 2005, 2007: the winner TUD Nuna . M. Zeman. Photovoltaic solar energy: key to a sustainable energy future. M. Zeman Delft University of Technology. Loy Energy Consulting, 9/2007. Acknowledgements:

E N D
World Solar Car Race 2001, 2003, 2005, 2007:the winner TUD Nuna M. Zeman
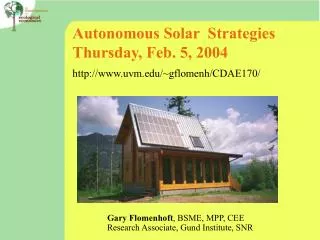
Photovoltaic solar energy:key to a sustainable energy future M. Zeman Delft University of Technology Loy Energy Consulting, 9/2007 Acknowledgements: Wim Sinke (ECN,Leader of WG 3 : Science, technology & applications of EU PV Technology Platform) Netlef Loy(Loy Energy Consulting)
World energy consumption in 2004 Total: 473 EJ Rest: 66 EJ Renewables: 6 EJ 420 EJ = 10 000 Mtoe 1 PJ = 278 GWh 1 PJ ~ 32 MW installed power Source: BP, Statistical review of world energy, June 2006
Slovakia energy consumption in 2004 Total: 0,81 EJ Rest: 0,21 EJ Renewables: 1 PJ Source: Eurostat, Energy, September 2007
Electricity generation 2005 Selected EU countries: Source: Eurostat, Energy, September 2007 The use and implementation of renewable energy sources is low!
World fossil-fuel energy consumption • Two major global problems: • Shortage of energy • Climate change • Solutions: • Efficient use of energy • Renewable energy sources Original photograph taken in 1928 of the Upsala glacier, Patagonia, Argentina, compared with the receding glacier today.
World fossil-fuel energy consumption 1 barrel = 117.35 liters Brent Crude Oil $/barrel 2007(source BBC) Crude oil: 0.85$/l CocaCola: 1,00$/l Mexico, Tabasco floods, November 2007 (source BBC)
The energy transitions Advisory Council to the German government on global climate change WBGU (2003)
Energy sources 2050: 1000 EJ (32 TW installed power) 2007: ~ 500 EJ (16 TW installed power) In 43 years additional 16 TW power has to be installed 16 000 GW/15695 days = ~ 1 GW/day Nuclear Power Plant Bohunice Installed capacity: 2×440 MW From now on everyday for coming 43 years one nuclear power plant of 1 GW capacity has to be build to fulfil the future energy requirements
World fossil-fuel energy consumption 1000×Mtoe 1. solar age 2. solar age World consumption of fossil fuels 10 consumption 5 -1000 0 1000 2000 3000 4000 5000 Time [years]
Solar energy Solar energy is a generic term for a number of different techniques which convert the solar energy into useful energy Direct (energy directly converted into a useful energy): • Solar electricity (photovoltaics) • Solar heat (thermal collectors) In-direct (energy converted into a useful energy in steps): • Wind • Biomass (not sensitive for changes in energy supply) • Hydro (not sensitive for changes in energy supply)
Photovoltaics Photovoltaics (PV)literally means "light-electricity" • direct conversion of light into electricity based on the photovoltaic effect • advanced semiconductor device: solar cells (do not confuse with solar collectors) • the main energy source for the "post-fossil-era"
Solar Cells • - convert light directly into electricity • Advantages: • Modular • Minimal maintenance • You make business with it
Solar resource Loy Energy Consulting, 9/2007
Solar resource At 10% overall efficiency (generation & storage): 1200x1200 km2 to supply 2050 energy needs(~1000 EJ) http://visibleearth.nasa.gov
Solar cell operation Solar cell operation is based on the photovoltaic effect: The generation of a voltage difference at the junction of two different materials in response to visible or other radiation.
I-V measurement Standard test conditions: AM1.5 spectrum irradiance 1000 W/m2 temperature 25C Open circuit voltage Voc [V] P Peak Power Pmax [Wp] Short circuit current Isc [A] External parameters External parameters: • Short circuit current Isc [A] • Open circuit voltage Voc [V] • Fill factor ff • Maximum (peak) power Pmax [Wp] • Efficiency η
Solar cell semiconductor device Solar panel (PV module) different than collector Solar array Solar system: solar panel battery inverters, conditioners electrical components appliance PV system
World of photovoltaics PV industry: the fastest growing industry in the world Solar cell production 1999-2006 Market Jobs Predictions MW 2006: 90% wafer-type c-Si technology 2536 1815 40% 1256 45% 750 560 Estimation market: 2005 ~ 9 000x106 € ~ 70 000 jobs 68% 401 287 202 34% 39% 40% 42% Photon International, March 2007
Status solar cell technologies Technology Efficiency[%] Record cell Record module Commercial module Cost reduction c-Si 24.7 Mono 19.8 Multi 16.6 transfer 22.7Mono 15.3Multi 12-17 Limited TF Si (stabilised) 9.3 Single 12.4Tandem 13.4Triple 10.4 Triple 5-9 ++ CIS 18.9 13.4 9-11 ++ CdTe 17.0 10.7 6-7 ++ DSC Polymer 11 unstable 4.7 not available ++? HIT 22.3 ? 16-17 Limited Heterojunction with Intrinsic Thin Layer
Space application Terrestrial application Bulk c-Si Thin Films GaAs η~24 % c-Si η~12 % η~18% Mono c-Si η ~ 15-17% Multi c-Si η ~ 13-15% CIGS ηlab ~ 19% ηind ~ 12% CdTe ηlab ~ 16% ηind ~ 9% Poly c-Si ηlab ~ 16% ηind ~ 9% TF Si a-Si:H ηlab ~ 13% ηind ~ 9% Organic ηlab ~ 11% Solar cell applications GaAs (Gallium Arsenide) CIGS (Copper Indium Gallium Diselenide) CdTe (Cadmium Telluride) a-Si:H (Hydrogenated amorphous silicon)
PV installed power Selected EU countries:
PV installed power Logarithmic scale!
PV installed power Logarithmic scale! grid-connected off-grid Slovakia 0 MW 0,004 + 0,060? MW Czech Rep. 0.15 MW 0,62 MW
PV market 2006 Germany is the biggest PV-market since 2004 Loy Energy Consulting, 9/2007
PV installed power Stratégia vyššieho využitia OZE pre SR Tabuľka č. 8: Výroba elektriny v roku 2015 Zdroj: MH SR
Development of German PV market PV Market Data 2006 Newly installed power: 750 MWp Total installed power: 2,540 MWp No. of newly installed systems: 90,000 No. of total systems installed: 300,000 Turnover 2006: 3.8bn € (5b US$) Employees: 35,000 Milestones 1991: First Feed-in Law 2000: Renewable Energy Sources Act (EEG) 2004: Amendment of EEG EPIA 2007
German successful strategy ● More than €10 billion were invested in PV systems since 2000 ● More than €2 billion were invested in manufacturing plants since 2000 – About 40 companies produce silicon, wafers, cells, modules and inverters – Modern and automated production lines – Strong technological development and increased R&D activities – Improved efficiency, improved products ● Falling costs for PV systems of – approx. 25% from 1999 to 2003 – 60% from 1991 to 2003 – price reduction of 10% since June 2006 Loy Energy Consulting, 9/2007
German PV industry Loy Energy Consulting, 9/2007
German motivation for Solar Energy • Common political understanding that… • the growing oil price demonstrates that energy supply is limited • we have to reduce CO2 emissions drastically due to the growing effects of climate change • Solar energy has to be developed today because… • the worldwide energy demand is growing • it is needed in a sustainable energy mix due to its huge potential and worldwide availability • the price can only be reduced by mass production • solar industry is offering future-oriented jobs • => Solar energy has to be developed today in order to have • (1) enough solar energy capacity available by 2020 • (2) at a competitive price
German PV: Summary • The German PV market is the biggest market worldwide with about 1 GW new installed capacity in 2007 • Every fourth solar cell comes from manufacturer in Germany • Driver is the feed-in tariff system (EEG) • The EEG amendment is under discussion, decisions will probably be taken in 2008: Degression will be increased stepwise to probably 9%, i.e. 20 €-ct/kWh to be reached for larger roof-mounted systems by 2017. – The German Solar Association BSW is expecting a moderate growing PV market in Germany in the coming years, but fast growing PV markets in other European countries (Spain, Italy), US and other parts of the world = growing export market (current export rate is 40%) – 15 new solar factories expected until end of 2008
Primary challenge of PV systems Cost reduction of factor 5 to become competitive with conventional electricity Today PV module price: 3.5 €/Wp(Wp = Watt peak) Integral approach: Reducing module costs raw materials & labor, investments efficiency, lifetime Optimizing systems integration area and power related costs Note: overall optimum highest efficiency
Euro/Wp 10 2,5 €/Wp 1 1 10 100 1.000 10.000 100.000 cumulative shipments MWp PV module-price learning curve The combined effect of technology development and manufacturing experience 1980 Progress ratio = 80% 2005 1 Euro = 1,2 USD Source: PSE GmbH, 2005
PV Technology platform The Photovoltaic Technology Platform is an initiative which aims at mobilising all the actors sharing a long-term European vision for photovoltaic: • realising the European Strategic Research Agenda • give recommendations for its implementation • ensuring that Europe maintains industrial leadership Strategic Research Agenda for Photovoltaic Solar Energy Conversion Technology http://www.eupvplatform.org
Evolution of solar cell technologies 4 tf-Si = thin-film siliconCIGS = copper-indium/ gallium-elenium/sulfurCdTe = cadmium telluridec-Si= wafer-type c-SiOSC= “organic” & nanohybrid solar cells new concepts = advanced existing technologies & new conversion principles technology families 2005 c-Si 3 tf-Si, CdTe, & CIGSS technology generations 2010 module price (€/Wp) 2 OSC 2020 1 new concepts >2030 0 (free after W. Hoffmann) 0 5 10 15 20 25 module efficiency (%)
2005 PV electricity price (€ / kWh) consumer electricity price (€ / kWh) 0.50 0.22 0.14 0.16 0.42 PV electricity prices*) compared with typical consumer electricity prices 0.16 0.11 0.36 0.31 0.20 *) depreciation 25 yrs, real interest rate 4%, O&M cost 1%/yr, PR 0.75 (example) 0.12 0.10 0.28 “grid parity” PV electricity price
2010 PV electricity price (€ / kWh) consumer electricity price (€ / kWh) 0.35 0.23 0.15 0.17 0.29 PV electricity prices compared with expected consumer electricity prices (+ 1%/yr) 0.17 0.11 0.25 0.22 0.21 0.13 0.11 0.19 PV electricity price
2015 PV electricity price (€ / kWh) consumer electricity price (€ / kWh) 0.25 0.24 0.16 0.18 0.21 PV electricity prices compared with expected consumer electricity prices (+ 1%/yr) 0.18 0.12 0.18 0.16 0.22 0.13 0.11 0.14 PV electricity price
2020 PV electricity price (€ / kWh) consumer electricity price (€ / kWh) 0.20 0.26 0.16 0.19 0.17 PV electricity prices compared with expected consumer electricity prices (+ 1%/yr) 0.19 0.12 0.14 0.13 0.23 0.14 0.12 0.11 PV electricity price
2030 PV electricity price (€ / kWh) consumer electricity price (€ / kWh) 0.10 0.28 0.18 0.20 0.08 PV electricity prices compared with expected consumer electricity prices (+ 1%/yr) 0.20 0.14 0.07 0.063 0.26 0.15 0.13 0.055 PV electricity price
Summary • PV technologies: • Current PV technologies well established • Reliable product with sufficient efficiency and energy output • > 20 years lifetime guaranty • 90% wafer-based c-Si technology, complete production lines available • Current developments: • Shortage of Si feedstock => increase of Si production facilities • Move to thinner Si wafers and more efficient solar cells • Significant expansions of production facilities • Increase in TF solar-cell production, recently production lines available A. Jäger-Waldau, PV Status Report 2006.
Summary • PV industry: • Solar PV industry is the industry of future • Driver for the development is the effective feed-in tariff system • Solar PV has become big business • Solar PV industry helps bring about a cleaner environment, offer independence from fossil fuels, protect against utility rate volatility, and bring job growth and thus increased revenue to individuals and countries M. Zeman
Grid-connected PV system in Germany Every kWh of solar electricity produced is fed into the grid, sold to the utility and re-paid with a fixed price Typical data of a small PV system (per kWp) Investment costs: 4,800 € (6,400 US$) Annual production of solar electricity: 900 kWh/a Feed-in tariff: 0.492 €/kWh (0.65 US$/kWh) payed over 20 years Feed-in payment: 443 €/a (590 US$/a) Interest rates:4.7%/a eff PV array combiner (junctions box) PV array Load Import/Export meter Connection to grid Grid-tied inverter 1 US$ = 0.75 €