Download
1 / 27
270 likes | 410 Views
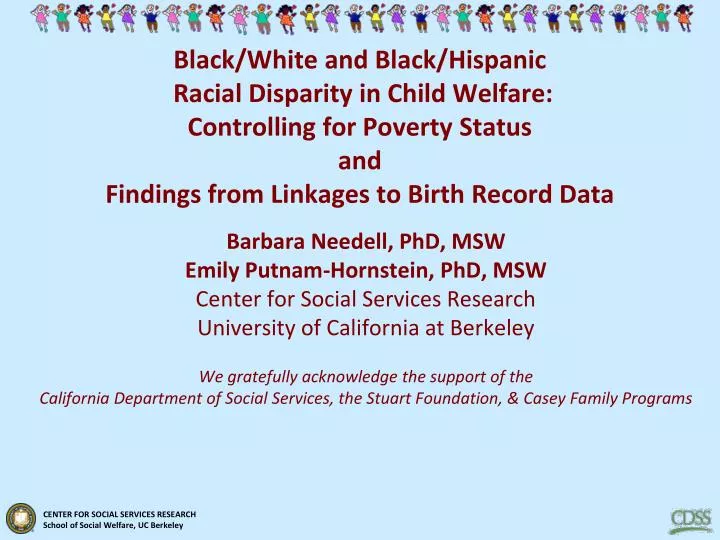
Black/White and Black/Hispanic Racial Disparity in Child Welfare: Controlling for Poverty Status and Findings from Linkages to Birth Record Data. Barbara Needell, PhD, MSW Emily Putnam-Hornstein, PhD, MSW Center for Social Services Research University of California at Berkeley

E N D
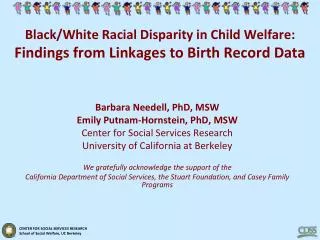
Black/White and Black/Hispanic Racial Disparity in Child Welfare:Controlling for Poverty StatusandFindings from Linkages to Birth Record Data Barbara Needell, PhD, MSW Emily Putnam-Hornstein, PhD, MSW Center for Social Services Research University of California at Berkeley We gratefully acknowledge the support of the California Department of Social Services, the Stuart Foundation, & Casey Family Programs
poverty data • 2005-2010 estimates of the population of children (ages 0-17) living in poverty by race/ethnicity • using the U.S. Census Bureau's 2005-2009 American Community Survey (ACS) 5-Year Estimates, poverty multipliers were calculated by race/ethnicity for California and each of its 58 counties • multiplier applied to the California Department of Finance Population Estimates for the years 2005-2010 http://cssr.berkeley.edu/ucb_childwelfare/population.aspx
why are people poor? * 2010 Estimates of CA Children in Poverty • Black 28% • White 8% • Hispanic 26% • Asian/PI 11% • Native American 25% * http://www.pisab.org/
definitions disproportionality: when a group makes up a proportion of those experiencing some event that is higher or lower than that group’s proportion of the population disparity:a comparison of one group (e.g, regarding disproportionality, services, outcomes) to another group population in poverty: disproportionality calculated using the population of children in poverty rather than the general population (census)
disproportionality disparity white white black black % % Ratio % % % %
Black Disproportionality 18.9% 5.9% White Disproportionality 27.0% 31.5% Hispanic Disproportionality 50.2% 51.4% Black vs. White Disparity Index 3.21 0.86 Black vs. Hispanic Disparity Index 3.21 0.98 = 3.21 = 0.86 = 0.98 = 3.74 = 3.29
Black Disproportionality 18.9% 9.0% White Disproportionality 27.0% 13.7% Hispanic Disproportionality 50.2% 70.2% Black vs. White Disparity Index 2.11 1.97 Black vs. Hispanic Disparity Index 2.11 0.72 = 2.11 = 1.97 = 0.72 = 1.07 = 2.95
data • Unique dataset constructed by linking children reported for maltreatment during the first five years of life to their birth record • state CWS/CMS records linked to vital birth records • probabilistic methods (84% of child welfare records matched) • 530,843 children born alive in CA in 2002 • 14% reported for maltreatment (N=74,182) • 6% substantiated as a victims (N=27,805) • 0.8% entered foster care (N=4,388) • Racial disparities? • examined aggregate Black vs. White and Black vs. Hispanic disparity across decision points • estimated child level risk at each decision point, after adjusting for other risk factors
why are people poor? * * http://www.pisab.org/
the problem with summary statistics: The average human has one breast and one testicle. * * ~Des McHale www.quotegarden.com/statistics.html
what is hidden beneath the summary statistics? • Significant racial variations in the presence of risk factors that are associated with disparities… • In multivariate models, we adjusted for twelve sociodemographicand biomedical risk factors for contact with child protective services: • child’s sex (n.s.), low birth weight, birth abnormality, prenatal care, maternal birth place, maternal race/ethnicity, birth payment method, maternal age, maternal education, abortion history, paternity information, birth order • Significant interactions between a number of covariates and Medi-Cal coverage led us to stratify models
conclusions from data • summary statistics indicating disparities mask large covariate effects • Black/White disparity is not present (and even) reversed for lower income children/ mothers • Black/Hispanic disparity is diminished but remains for lower income children/mothers
more questions than answers… • Are the service needs of Black, Hispanic, and White children and families being addressed? • Are “thresholds” the same for Black, Hispanic, and White children and families? • What are the appropriate rates for Black, Hispanic, and White children (and children of other race/ethnicities)?
Questions? Comments? bneedell@berkeley.edu Needell, B., Webster, D., Armijo, M., Lee, S., Dawson, W., Magruder, J., Exel, M., Cuccaro-Alamin, S., Putnam-Hornstein, E., Williams, D., Simon, V., Hamilton, D., Lou, C., Peng, C., Moore, M., Jacobs, L., & King, B. (2011). Child Welfare Services Reports for California. Retrieved 7/4/2011, from University of California at Berkeley Center for Social Services Research website. URL: http://cssr.berkeley.edu/ucb_childwelfare.