Download
1 / 22
220 likes | 334 Views
Potential for Near-real-time Dataflow Monitoring with GeoWall. Dr. Kent Lindquist Lindquist Consulting, Inc. May 10, 2004. ROADNet Collaboration. ROADNet Team Atul Nayak, Todd Hansen, Rob Newman, …. Real-time Data Observatories. ROADNet: Live, working testbed Sensor grid Data grid

E N D
Potential for Near-real-time Dataflow Monitoring with GeoWall Dr. Kent Lindquist Lindquist Consulting, Inc. May 10, 2004
ROADNet Collaboration • ROADNet Team Atul Nayak, Todd Hansen, Rob Newman, … Lindquist Consulting, Inc.
Real-time Data Observatories • ROADNet: Live, working testbed • Sensor grid • Data grid • Large Data Volume (multiple GB/day) • Many Hundreds of Sensors • Geographically Distributed • (of course! It’s earth monitoring…) • Fundamentally a 3D (4D) problem • Multidisciplinary Lindquist Consulting, Inc.
Challenges • How do you: • Make sure the sensor network is all working • Get intuitive overview of what’s happening Lindquist Consulting, Inc.
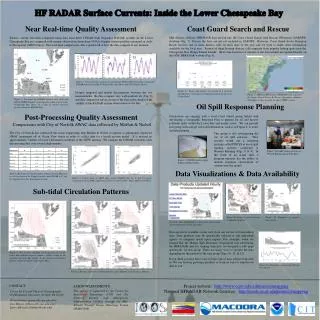
Application Domains • Seismic Monitoring • HF Radar Ocean-current Monitoring • Remote cameras • Satellite data • Many others: water quality, stream level, fuel moisture, fuel load, NMEA, ADCP, shipboard GPS and Gyroscopic data, Land-based GPS, Weather, etc. • Plus: Network engineering metrics • Dataflow • Dynamic Network Topology Lindquist Consulting, Inc.
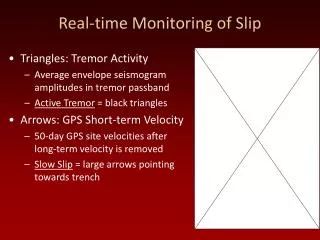
Real-time Monitoring Challenges • Seismic Network State of Health • Which stations are operating • Which are behind (time lag greater than expected) • Which have gaps, glitches, etc. • Which have stopped sending data • What patterns are there in any problems (=>cause) • Past approaches: • 2D scrolling waveform displays • Monitoring scripts • Manual data-scanning • Daily summary emails • Summary web pages, gap reports Lindquist Consulting, Inc.
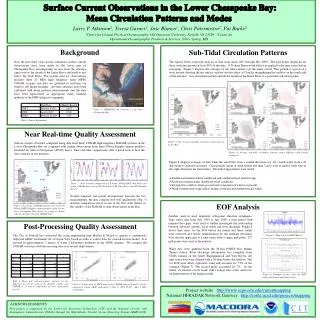
2D Seismic Monitoring • Near-real-time packetized waveform acquisition • Includes energy detection, network triggering, phases • Hard with 400 stations Lindquist Consulting, Inc.
Sample seismic station map Lindquist Consulting, Inc.
Real-time Monitoring Opportunities • Four dimensional character of monitored wavefield • Better overview: patterns emerge, telemetry problems etc. • Wavefield propagation • Visual integration of complex, time-dependent events • Single-station detections • Network triggers • Earthquake Locations • Earthquake Vital statistics—size etc. • Earthquake effects: QuakeMaps • Information density and clarity of relationships in 4D view allows human pattern recognition to work at its best Lindquist Consulting, Inc.
Latest Auto-detected Earthquakes • Value added from processing: • Earthquakes automatically detected within minutes by automated system Lindquist Consulting, Inc.
Virtual Reality Earthquake View Lindquist Consulting, Inc.
Earthquake Ground-motion estimation Quick script to show Qgrids out of a database Peak Ground Acceleration Trinetsm_es99 delegate May 31, 2003 17:12 GMT ML 3.14 Max 0.076 g Lat 32.6513 Lon -116.7682 Lindquist Consulting, Inc.
Earthquake Ground-motion Estimation May 12, 2003 22:35 GMT ML 2.95 Max 0.084 g Lat 33.2710 Lon -116.0527 db=dbopen('ssn','r'); db=dblookup(db,'','qgrid','orid','24'); cgg=cggrid(dbfilename(db)); [x,y,z]=cggrid_getmesh(cgg); mysurfc(x,y,z) Lindquist Consulting, Inc.
Joint Image / Seismic Monitoring Coronado Bridge Monitoring Experiment May 15, 2002 Structural-health camera For bridge bearing; Seismic strong-motion instrument Array of distributed cameras needs easy overview Lindquist Consulting, Inc.
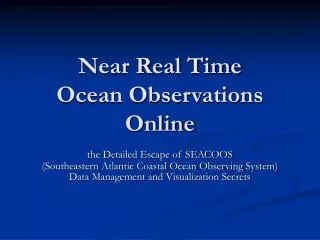
Near-real-time Time-Lapse Movies • Geographically Distributed Cameras • Relational Database of source images • Need GeoWall Stereo N-R-T movies! Lindquist Consulting, Inc.
Current GeoWall Efforts • Wiggleview • Live seismic data on GeoWall • Live Seismoglyphs • Near-real-time geo-located image display Lindquist Consulting, Inc.
Wiggleview Seismogram Display Lindquist Consulting, Inc.
Wiggleview Seismograms Lindquist Consulting, Inc.
Seismoglyphs Lindquist Consulting, Inc.
Geo-referenced Images Lindquist Consulting, Inc.
Pinon Flats Observatory Image Lindquist Consulting, Inc.
Summary • GeoWall can be a powerful resource for Geophysical Data Observatories • Inherently 4D visualization problem • Overview of Network State of Health not available with 2D applications • Fast, Intuitive Overview of Near-real-time Earth Events: information density integrates the picture more than 2D media can achieve • Suited for multidisciplinary study (ROADNet) Lindquist Consulting, Inc.