Download
1 / 12
120 likes | 282 Views
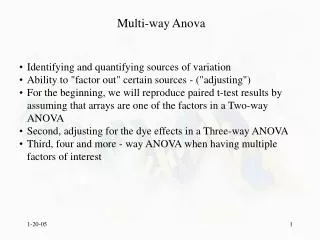
Two- Factor ANOVA K ij =1 (11.1). Two Factors of Interest (A) and (B) I = number of levels of factor A J = number of levels of factor B K ij = number of observations made on treatment (i,j). Example.

E N D
Two- Factor ANOVA Kij=1 (11.1) • Two Factors of Interest (A) and (B) • I = number of levels of factor A • J = number of levels of factor B • Kij = number of observations made on treatment (i,j)
Example • Consider an experiment to test the effect of heat and pressure on the strength of a steel specimen. Specifically, the test will consider the temperatures 100,120,130,140 degrees Celsius and the pressures 100,150,200 psi. Each temp/pressure combination will be observed once • Factor A = Temp, B =Pressure • I=4, J=3, Kij=1
Example Cont’d Observed data may be summarized in a table
The Model Xij=ij + ij • This model has more parameters than observations • A unique additive (no interactions) linear model is given by Xij= + i + j + ij Where i=0, j=0, ij~N(0,2)
Additive Model • Necessary assumption since Kij=1 • The difference in mean responses for two levels of factor A(B) is the same for all levels of factor B(A); i.e. The difference in the mean responses for two levels of a particular factor is the same regardless of the level of the other factor
Interpretation of the Model • = The true grand mean • i = The effect of factor A at level i • j = The effect of factor B at level j
Hypothesis of Interest • HoA: 1 = 2=…= i =0 • HaA: at least one i 0 • 2. HoB: 1 = 2=…= j =0 • HaB: at least one j 0
Multiple Comparisons Use only after HoA and/or HoB has been rejected