Download
1 / 1
10 likes | 87 Views
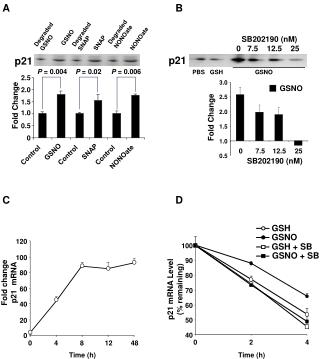
Comparative analysis of GSNO, SNAP, and SB effects on p21 mRNA levels in cellular models over time, revealing significant changes in gene expression.

E N D
GSNO NONOate SNAP GSH GSNO p21 120 GSH + SB 100 P = 0.004 P = 0.02 P = 0.006 GSNO + SB 100 2.5 90 2.0 80 80 Fold change p21 mRNA 1.5 p21 mRNA Level (% remaining) Fold Change 60 70 1.0 40 60 0.5 0 50 20 GSNO SNAP 40 0 Control Control Control A B NONOate 0 2 4 0 4 8 12 48 Time (h) Time (h) Degraded NONOate Degraded SNAP Degraded GSNO SB202190 (nM) 0 7.5 12.5 25 p21 PBS GSH GSNO 3.0 GSNO 2.5 2.0 Fold Change 1.5 1.0 0 7.5 12.5 25 0.5 SB202190 (nM) C D