Download

1 / 13
130 likes | 334 Views
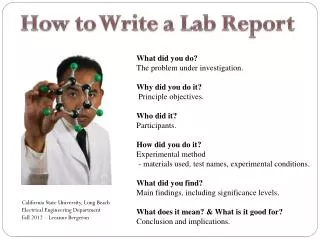
How to Write a Lab Report For Chemistry. September 2007. Begin with your Content Headings:. Title Introduction & Hypothesis: (In Chemistry, there may not be an hypothesis). Materials: Method: Results: Conclusion:. First write the name of the Lab, this will be your title.

E N D
How to Write a Lab ReportFor Chemistry September 2007
Title Introduction & Hypothesis:(In Chemistry, there may not be an hypothesis). Materials: Method: Results: Conclusion:
First write the name of the Lab, this will be your title. Differences in Pennies Minted prior to 1982 and Minted Today
Next add your introduction and hypothesis: Can physical properties be used to show the difference between pennies minted prior to 1982 and pennies minted since? • My hypothesis is that
The third item you will write will be a list of the materials used in the experiment: Materials:
The fourth piece of information will be the method, or how you performed the experiment. You may draw a picture to add information:
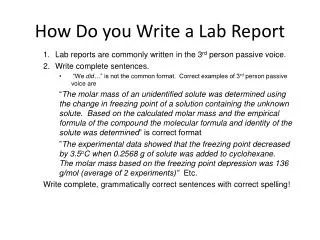
Method:(Try to eliminate pronouns, keep the voice in the third person). Pennies were weighed and…
The next part of your report will be your results, which may be written in sentences, or in the form of a data table, graph or chart. Try to create a graph now using Excel.
Look for the icon with the greenXClick on the X.Now, for practice, create a data table using thedata from a previous lab, or make some up. Be sure to label the variables on the data table.
Once you have entered the data, save your file. Using the cursor, highlight your data table. Now select “insert” then “chart”.Repeat this process several times, creating different graphs with your one set of data. Once created, use “insert” to add the graph into your report, or print a hard copy and attach it.
The last part of your report will be your thoughtful conclusions. This is where you can relate whether your hypothesis was accurate, explain any errors you found, and even offer your opinion.
Be sure your name in on the top, and the date. Be sure to turn in your report. Save a copy on the server, just in case.