Download
1 / 106
1.07k likes | 1.31k Views
NMR theory and experiments. NMR theory and experiments Analytical Chemistry TIGP, Academia Sinica. Instructor: Der-Lii M. Tzou. Place: A508, IC. Hour: 9:00~12:00 am June 6, 2007 (02) 2789-8524 email:tzou@ccvax.sinica.edu.tw. Applications of NMR to Biological Systems

E N D
NMR theory and experiments
NMR theory and experiments Analytical Chemistry TIGP, Academia Sinica Instructor: Der-Lii M. Tzou Place: A508, IC Hour: 9:00~12:00 am June 6, 2007 (02) 2789-8524 email:tzou@ccvax.sinica.edu.tw • Applications of NMR to Biological Systems (a) 1D NMR and chemical shifts (b) J-coupling (c) T1 and T2 relaxation (d) NOE and 2D NOE spectroscopy (d) 2D TOCSY spectroscopy (e) 2D COSY spectroscopy (f) 1H, 13C, 15N NMR spectroscopy and high resolution multi-dimensional NMR (g) Other nuclear spin interactions • NMR basics and principle (a) Rotation spectroscopy (b) Larmor frequency (c) Resonance, Fourier transfer
Bo Bo >> Mo With External Magnetic Field mi = Mo 0
Number of spin states (2I+1) : A nucleus with spin I can have 2I+1 spin states. Each of these states has its own spin quantum number m ( m=-I,-I+1,…, I-1, I ). For nuclei with I=1/2, only two states are possible : m=+1/2 and m=-1/2. Nuclear Zeeman effect : m=-1/2 E=-mB0(γh/2π) B0 : magnetic field strength h : Planck’s constant m : spin quantum number γ: magnetogyric ratio ΔE 0 E m=+1/2 B0
Z (∥B0) Z pulse Data acquisition (detection) M delay FID time M1 Y Y M2 B1 X X
3D-FID (Free Induction Decay) 共振後磁向量的軌跡
CH3 H (CH3)4Si CH3Li CH3 CH4 H 8 6 4 2 0 -2 Chemical shift(ppm) H Examples : Increased shielding upfield low frequency downfield high frequency Increased deshielding
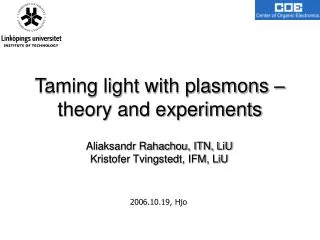
1H-1H TOCSY דף זה בעברית 1H-1H TOCSY (TOtal Correlated SpectroscopY also known as HOHAHA – HOmonuclear HArtmann HAhn) is useful for dividing the proton signals into groups or coupling networks, especially when the multiplets overlap or there is extensive second order coupling. A TOCSY spectrum yields through bond correlations viaspin-spin coupling. Correlations are seen throughout the coupling network and intensity is not related in a simple fashion to the number of bonds connecting the protons. Therefore a five-bond correlation may or may not be stronger than a three-bond correlation. TOCSY is usually used in large molcules with many separated coupling networks such as peptides, proteins, oligosaccharides and polysaccharides. If an indication of the number of bonds connecting the protons is required, for example in order to determine the order in which they are connected, a COSY spectrum is preferable. The pulse sequence used in our laboratory is the gradient enhanced TOCSY. The spin-lock is a composite pulse and should be applied for between 20 and 200 ms with a pulse power sufficient to cover the spectral width. A short spin-lock makes the TOCSY more COSY-like in that more distant correlations will usually be weaker than short-range ones. A long spin-lock allows correlations over large coupling networks. Too long a spin-lock will heat the sample causing signal distortion and can damage the electronics of the spectrometer. The attenuation should be set so that the 90° pulse with will be less than 1/(4SWH) (SWH is the spectral width in Hz) and typically 1/(6SWH). An attenuation of 12 dB with a 50 W amplifier yielding a 90° pulse width of 35 μs is typical. 1H-1H spin-spin J-coupling observed by NMR The effective magnetic field is also affected by the orientation of neighboring nuclei. This effect is known as spin-spin coupling which can cause splitting of the signal for each type of nucleus into two or more lines.
Returning to the example of ethylbenzene, the methyl (CH3) group has a coupling pattern in the form of A3X2 which to a first order approximation looks like an AX2 multiplet. Likewise, the methylene (CH2) group has the form A2X3 that is equivalent to AX3. The first order approximation works because the groups are widely separated in the spectrum. The aromatic signals are close together and display second order effects. The ortho signal is a doublet AX while the meta and para signals are triplets
Isolated spins (Zeeman effect, Larmor Frequency)Electron cloud (chemical shift)Scalar coupling (J-coupling through chemical bonds)Dipolar interaction (NOE through space)* Spin dynamics (T1, T2… relaxations)
Longitudinal relaxation or spin-relaxation relaxation T1 Longitudinal relaxation (T1) is the mechanism by which an excited magnetization vector returns to equilibrium (conventionally shown along the z axis). Inversion recovery curve for the methyl protons of ethylbenzene (0.1%) in CDCl3 at 400 Mhz The inversion recovery (T1) pulse sequence yields a signal of intensity
Transverse relaxation T2, spin-spin relaxation Transverse relaxation (T2) is the mechanism by which the excited magnetization vector (conventionally shown in the x-y plane) decays. This is always at least slightly faster than longitudinal relaxation. Spin-echo experiment for proton spectrum of ethylbenzene (0.1%) in CDCl3 at 400 MHz, the residual water peak on the left relaxes faster than the methyl on the right. Exponential decay curve for the methyl protons of ethylbenzene (0.1%) in CDCl3 at 400 MHz
One Dimensional NMR Spectroscopy The 1D experiment Each 1D NMR experiment consists of two sections: preparation and detection. During preparation the spin system is set to a defined state. During detection the resulting signal is recorded. In the simplest case the preparation is a 90 degree pulse (in our example applied along the x axis) which rotates the equilibrium magnetization Mz onto the y axis (My). After this pulse each spin precesses with its own Larmor frequency around the z axis and induces a signal in the receiver coil. The signal decays due to T2 relaxation and is therefore called free induction decay (FID). Usually, the experiment is repeated several times and the data are summed up to increase the signal to noise ratio. After summation the data are fourier transformed to yield the final 1D spectrum.
Anatomy of a 2D experiment 90x 90y t1 t2 FID Preparation Evolution Mixing Time Detection The construction of a 2D experiment is simple: in addition to preparation and detection which are already known from 1D experiments the 2D experiment has indirect evolution time t1 and a mixing sequence. The scheme can be viewed as : Do something with the nuclei (preparation), let them precess freely (evolution), do something else (mixing), and detect the result (detection, of course)
Anatomy of a 3D experiment t1 m t2 t3 FID MLEV Preparation Evolution Mixing Time Evolution Mixing Time Detection A three dimensional NMR experiment (see picture above) can easily be constructed from a two-dimensional one by inserting an additional indirect evolution time and a second mixing period between the first mixing period and the direct data acqusition. Each of the different indirect time periods (t1, t2) is incremented separately. Triple resonance experiments are the method of choice for the sequential assignment of larger proteins (> 150 AA). These experiments are called “triple resonance” because three different nuclei (1H, 13C, 15N) are correlated. The experiments are performed on doubly labeled (13C, 15N) proteins.
Anatomy of a 2D experiment - continued After preparation the spins can precess freely for a given time t1. During this time the magnetization is labeled with the chemical shift of the first nucleus. During the mixing time magnetization is then transferred from the first nucleus to a second one. Mixing sequence utilize two mechanisms for magnetization transfer: scalar coupling (J-coupling) or dipolar interaction (NOE). Data are acquired at the end of the experiment (detection, often called direct evolution time); during this time the magnetization is labeled with the chemical shift of the second nucleus.
2D COSY (COrrelated SpectroscopY) In the COSY experiment, magnetization is transferred by scalar coupling (J-coupling). Protons that are more than three chemical bonds apart give no cross signal because the 4J coupling constants are close to 0. Therefore, only signals of protons which are two or three bonds apart are visible in a COSY spectrum (red signals). The cross signals between HN and H protons are of special importance because the phi torsion angle of the protein backbone can be derived from the 3J coupling constant between them.
2D TOCSY (TOtal Correlated SpectroscopY) In the TOCSY experiment, magnetization is dispersed over a complete spin system of an amino acid by successive scalar coupling (J-coupling). The TOCSY experiment correlates all protons of a spin system. Therefore, not only the red signals are visible (which also appear in a COSY spectrum) but also additional signals (green) which originate from the interaction of all protons of a spin system that are not directly connected via three chemical bonds. Thus a characteristic pattern of signals results for each amino acid from which the amino acid can be identified. However, some amino acids have identical spin systems and therefore identical signal patterns. They are: cysteine, aspartic acid, phenylalanine, histidine, asparagine, tryptophane and tyrosine ('AMX systems') on the one hand and glutamic acid, glutamine and methionine ('AM(PT)X systems') on the other hand.
TOCSY TOCSY TOCSY C C C H H H H H H N N N C C C C C C H H H H H H O O O NOESY COSY COSY COSY NOESY
2D NOESY (Nuclear Overhauser Effect Spectroscopy) The NOESY experiment is crucial for the determination of protein structure. It uses the dipolar interaction of spins (the nuclear Overhauser effect, NOE) for correlation of protons. The intensity of the NOE is in first approximation proportional to 1/r6, with r being the distance between the protons: The correlation between two protons depends on the distance between them, but normally a signal is only observed if their distance is smaller than 5 Å. The NOESY experiment correlates all protons which are close enough. It also correlates protons which are distant in the amino acid sequence but close in space due to tertiary structure. This is the most important information for the determination of protein structures
Example : Iy Iz Ix -Iz (90Ix) (90Iy) RF pulse : I I cos + I sin (I) , and represent permutations of the x, y and z axes and is the pulse flip angle
Chemical shift : Ix Ix cos (wIt) + Iy sin (wIt) Iy Iy cos (wIt) – Ix sin (wIt) (wItIz) (wItIz) 2IzSx 2IzSx cos – 2Iy Sx sin 2IxSz 2IxSz cos (wIt) + 2IySz sin (wIt) (Ix) (wItIz) Iz Sz Iy Sz Ix
J-coupling : Ix Ix cos (JISt) + 2IySz sin(JISt) 2IySz 2Iy Sz cos (JISt) - Ix sin (JISt) (JISt2IzSz) (JISt2IzSz) Example : Ix 2IySz (t = 1/2JIS) 2IySz - Ix (t = 1/2JIS) (JISt2IzSz) (JISt2IzSz)
COSY : (wtIz) a b: Ix Ix cos (wIt) + Iy sin (wIt) [Ix cos (wIt) + Iy sin (wIt)] cos(JISt) + [2IySz cos(wIt) - 2IxSz sin(wIt)] sin(JISt) (JISt2IzSz) (90Ix) (90Sx) (COSY) Ix -2IzSy cos(wIt) sin(JISt) 90x I: 90x S: t b a c b c: [Ixcos (wIt) + Iz sin (wIt)] cos(JISt) + [-2IzSy cos(wIt) + 2IxSy sin(wIt)] sin(JISt)
NOESY: (wtIz) a b: Ix Ix cos (wIt) + Iy sin (wIt) [Ix cos (wIt) + Iy sin (wIt)] cos(JISt) + [2IySz cos(wIt) - 2IxSz sin(wIt)] sin(JISt) (JISt2IzSz) (90Ix) 90x 90-x 90x t1 m t2 I: S: t a b d c e b c: [Ixcos (wIt) + Iz sin (wIt)] cos(JISt) + [2IzSz cos(wIt) + 2IxSz sin(wIt)] sin(JISt) c d: ?
180x HMQC : I: 90x 90x t S: d a b f c e (JISt2IzSz) a b: Ix 2IySz ( = 1/2JIS) b c: -2IySy c d: -2IySy cos(wSt) + 2IySx sin(wSt) d e: -2IySz cos(wSt) + 2IySx sin(wSt) e f: Ix cos(wSt) +2IySx sin(wSt) HMQC: Ix Ix cos(wSt) ( = 1/2JIS) (90Sx) (Dec CS) (90Sx) (JISt2IzSz)
Anatomy of a 3D experiment t1 m t2 t3 MLEV FID Preparation Evolution Mixing Time Evolution Mixing Time Detection A three dimensional NMR experiment (see picture above) can easily be constructed from a two-dimensional one by inserting an additional indirect evolution time and a second mixing period between the first mixing period and the direct data acqusition. Each of the different indirect time periods (t1, t2) is incremented separately. Triple resonance experiments are the method of choice for the sequential assignment of larger proteins (> 150 AA). These experiments are called 'triple resonance' because three different nuclei (1H, 13C, 15N) are correlated. The experiments are performed on doubly labelled (13C, 15N) proteins.
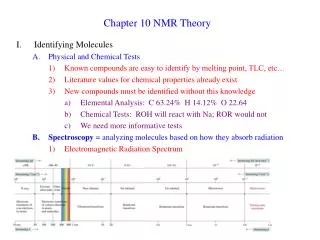
What’s kind of the structural information that we can observe from NMR ?
Structural information 1. Interproton distances : NOE R6 2.Dihedral angles : J-coupling and Karplus equations 3. Chemical Shift Index (CSI) : Chemical shift of Ha, Ca, Cb, CO 4.Hydrogen bonding : Amide proton exchange rates
The distances between vicinal protons vary between approximately 2.15 and 2.90 A, and the exact values are determined by the intervening torsion angle. For instance, the distances daN(i,i) and dab(i,i) are related with i and ci, respectively.
1H-1H distance in Proteins • Notation for 1H-1H distances daN(i,j) d(aHi, NHj) dNN(i,j) d(NHi, NHj) dbN(i,j) min{d(bHi, NHj)} daa(i,j) d(aHi, aHj) dab(i,j) min{d(aHi, bHj)}
Karplus relations • For structure determination of proteins the most important Karplus relations are • 3JNHa = 6.4 cos2q – 1.4cosq + 1.9 • 3Jab = 9.5 cos2q – 1.6cosq + 1.8 • 3JNb = -4.4 cos2q +1.2cosq + 0.1 • 3JC’b = 8.0 cos2q – 2.0cosq
NMR data with structural content : Chemical shifts (Ha ) a-helix b-sheet Random coil down field <Dd> (db-sheet - drandom coil ≈ 0.76 ppm) Coupling constants ( 3J ) For L-amino acid : 3J = 6.4 cos2(f – 60º) – 1.4cos(f – 60º) + 1.9 For D-amino acid : 3J = 6.4 cos2(f + 60º) – 1.4cos(f + 60º) + 1.9 3J > 9 Hz, f = -120º ± 30º 3J < 4 Hz, f = -30º ± 40º
a-13C Chemical Shift Values Categorized According to Secondary Structural Assignmenta-d a Experimentally measured random coil values from Richarz and Wuthrich and from Spear and Bax are included for comparison. Data are given in ppm. b The compounds (DDS, TMS, or dioxane) used in referencing the data are shown at the top of each column. c To adjust DSS values to “old” dioxane standard, substract 1.5 ppm. d To adjust DSS values to TSP, add 0.1 ppm. e Total number of residues observed is given in parentheses. The data cover a grand total of 1572 amino acids.
Random Coil Chemical Shifts for Backbone Atoms in Peptides and Proteinsa a Proton and carbon shifts are relative to DDS, nitrogen shifts are relative to NH3. Data are given in ppm. ba-1H shifts were measured using the hexapeptide GGXAGG in 1M urea at 25C. Wishart and Skyes, Methods Enzymol. (1994), 239 ,363-392.
(A) 1D 1H spectrum (B) 2D COSY spectrum (C) Same as (b), contour plot
Eight areas containing different connectivities : • a. All nonlabile, nonaromatic amino acid side chain protons except bH-gCH3 of Thr, dH-dH of Pro, and bH-bH of Ser. • b.aH-bCH3 of Ala and bH-gCH3 of Thr. • c.aH-bH of Val, Ile, Leu, Glu, Gln, Met, Pro, Arg, and Lys. • d.aH-bH of Cys, Asp, Asn, Phe, Tyr, His, and Trp. • e.aH-aH of Gly, aH-bH of Thr, dH-dH of Pro, aH-bH and bH-bH of Ser. • f. Aromatic ring protons, including the four-bond connectivity 2H-4H of His and side chain amide protons of Asn and Gln • g. Backone NH-aH. • h.dCH3–eNH of Arg.
(A) 1D 1H spectrum (B) 2D COSY spectrum (C) Same as (b), contour plot
Nuclear Overhauser Effects (NOE) • The NOE phenomenon is intimately related to spin relaxation. Analogous to the spin relaxation T1 and T2, the NOE varies as a function of the product of the Larmor frequency wo, and the rotational correlation time tc. • Considering a pair of closely spaced spins i and j, connected by the vector rij, and located either in a small or large spherical molecule. As a result of the collisions with the surrounding solvent and solute molecules, the thermal motions of these spheres consist of a random walk, which includes both translational and rotational movements. The relevant quantity for dipole-dipole relaxation and NOE is the rotational tumbling of the vector rij, and the concomitant time variation of the angle qij between rij and Bo. • If the mobility of this vector is restricted to the overall rotations of the molecule, rij will change orientation much more frequently in the small molecule than in the large molecule. For spherical particles of radius a in a solvent of viscosity , a correlation time characterizing the frequency range for these stochastic motions can be estimated as tc = 4a3/3kT