Download
1 / 41
420 likes | 628 Views
Chapter 6 Exploring Quadratic Functions and Inequalities. By Jennifer Huss. 6-1A Graphing Technology: Quadratic Functions. Functions with the form y=ax 2 +bx+c are called quadratic functions and their graphs have a parabolic shape

E N D
Chapter 6Exploring Quadratic Functions and Inequalities By Jennifer Huss
6-1A Graphing Technology: Quadratic Functions • Functions with the form y=ax2+bx+c are called quadratic functions and their graphs have a parabolic shape • When we solve ax2+bx+c=0 we look for values of x that are x-intercepts (because we have y=0) • The x-intercepts are called the solutions or roots of a quadratic equation • A quadratic equation can have two real solutions, one real solution, or no real solutions
6-1A Graphing Technology: Quadratic Functions (cont.) • On the calculator find roots using the ROOT menu • Choose a point to the left of the x-intercept and a point to the right of the x-intercept to give a range in which the calculator will find the x-intercept • Do this for each root you see on the graph
6-1A Example Graph y= -x2 - 2x + 8 and find its roots. Vertex: (-1, 9) Roots: (-4, 0) (2, 0) Viewing window: Xmin= -10 Xmax=10 Ymin= -10 Ymax= 10
6-1A Problems • Find what size viewing window is needed to view y= x2 + 4x -15. Find the roots. Window: Xmin= -10 Xmax= 10 Ymin= -20 Ymax= 10 Roots: -6.3589 and 2.3589
6-1 Solving Quadratic Equations by Graphing • In a quadratic equation y=ax2+bx+c, ax2 is the quadratic term, bx is the linear term, and c is the constant term • The axis of symmetry is a line that divides a parabola into two equal parts that would match exactly if folded over on each other • The vertex is where the axis of symmetry meets the parabola • The roots or zeros (or solutions) are found by solving the quadratic equation for y=0 or looking at the graph
6-1 Solving Quadratic Equations by Graphing (cont.) Graph with definitions shown: Three outcomes for number of roots: Two roots One root: No roots:
6-1 Example -x2: quadratic term -2x: linear term 8: constant term Vertex: x=(-b/2a) x= -(-2/2(-1)) x= 2/(-2) x= -1 For y= -x2 -2x + 8 identify each term, graph the equation, find the vertex, and find the solutions of the equation. Solve for y: y= -x2 -2x + 8 y= -(-1)2 -(2)(-1) + 8 y= -(1) + 2 + 8 y= 9 Vertex is (-1, 9)
6-1 Example (cont.) Find the roots for the Problem: -x2 -2x + 8 = 0 (-x + 2)(x + 4) = 0 -x + 2 = 0 x + 4 = 0 -x = -2 x = -4 x = 2 (2, 0) and (-4, 0) are the roots.
6-1 Problems • Name the quadratic term, the linear term, and the constant term of y= -x2 + 4x. • Graph y= 4x2 – 2x + 1 and find its vertex and axis of symmetry. • Find the roots of y= x2 – 8x + 12. • –x2: quadratic term 4x: linear term no constant term 2) (¼, ¾) x= ¼ 3) (2,0) and (6,0)
6-2 Solving Quadratic Equations by Factoring • Factor with the zero product property: if a*b=0 then either a=0 or b=0 or both are equal to 0 • Factoring by guess and check is useful, but you may have to try several combinations before you find the correct one • While doing word problems examine your solutions carefully to make sure it is a reasonable answer
6-2 Example Solve the equation (2t + 1)2 – 4(2t + 1) + 3 = 0. (2t + 1)(2t + 1) – 4(2t + 1) + 3 = 0 4t2 + 2t + 2t + 1 – 8t – 4 + 3 = 0 4t2 – 4t = 0 4t (4t – 1) = 0 4t = 0 t – 1 = 0 t = 0 t = 1 The solutions are 0 and 1.
6-2 Problems • Solve (5x – 25)(7x + 3) = 0. • Solve by factoring: 4x2 – 13x = 12. 1) 5 and -3/7 2) -3/4 and 4
6-3 Completing the Square • The way to complete a square for x2 + bx + ? is to take ½ x b and then square it • So for x2 + 6x + ? : ½ (6) = 3 32 = 9 Therefore, the blank should be 9. • If the coefficient of x2 is not 1, you must divide the equation by that coefficient before completing the square • Some roots will be irrational or imaginary numbers
6-3 Example Find the exact solution of 2x2 – 6x – 5 = 0. 2x2 – 6x – 5 = 0 x2 – 3x – 5/2 = 0 x2 – 3x + o = 5/2 + o x2 – 3x + 9/4 = 5/2 + 9/4 (x – 3/2)2 = 19/4 (x – 3/2)2 = 19/4 x – 3/2 = + 19/2 or x – 3/2 = - 19/2 Solution: x = 3/2 + 19/2 and x = 3/2 – 19/2
6-3 Problems • Find the value c that makes x2 + 12x + c a perfect square. • Solve x2 – 2x – 15 = 0 by completing the square. 1) c = 36 2) -3 and 5
6-4 The Quadratic Formula and the Discriminant • The quadratic formula gives the solutions of ax2 + bx + c = 0 when it is not easy to factor the quadratic or complete the square • Quadratic formula: • To remember the formula try singing it to the tune of the Notre Dame fight song or “Pop Goes the Weasel” x = -b +/- b2 – 4ac 2a
6-4 The Quadratic Formula and the Discriminant (cont.) • The b2 – 4ac term is called the discriminant and it helps to determine how many and what kind of roots you see in the solution
6-4 Example Find the discriminant of 3x2 + x – 2 = 0 and tell the nature of its roots. Then solve the equation. a = 3 b = 1 c = -2 x = -1 +/- 12 – 4(3)(-2) Discriminant = b2 – 4ac = 12 – 4(3)(-2) = 1 – (-24) = 1 + 24 = 25 So, there are two real roots and the solutions will be rational. 2(3) x = -1 +/- 25 6 x = -1 +/- 5 6 x = -1 + 5 x = -1 - 5 6 6 x = 2/3 x = -1 The solutions are 2/3 and -1.
6-4 Problems • Use the discriminant to tell the nature of the roots of -7x2 – 8x – 10 = 0. • Use the quadratic formula to solve the equation -15x2 – 8x – 1 = 0. 1) Discriminant = -216 2 imaginary roots 2) -1/3 and -1/5
6-5 Sum and Product of Roots • You can find the quadratic equation from the roots of the equation • If the roots are called S1 and S2, then S1 + S2 = -b/a and S1 x S2 = c/a • This gives us the coefficients of ax2 + bx + c = 0 • You can also use this method with imaginary roots or to check your solution to a quadratic equation
6-5 Example Write a quadratic equation from the given roots -4 and -2/3. -4 + -2/3 = -14/3 -4 x -2/3 = 8/3 a=3 b=14 c=8 3x2 + 14x + 8 = 0
6-5 Problems • Given the roots -1/3 and -1/5, write the quadratic equation. • Solve the equation x2 + 3x – 18 = 0 and check your answers using the sum and product of the roots. 1) 15x2 + 8x + 1 = 0 2) -6 and 3
6-6A Graphing Technology: Families of Parabolas • A parabola has the equation y = a (x – h)2 + k • The coefficients a, h, and k can be changed to create similar parabolas • Changing “k” moves the parabola up (k > 0) or down (k < 0) • A change in “h” moves the parabola to the right (h > 0) or left (h < 0) • Changing “a” makes a parabola open upwards (a > 0) or downwards (a < 0), and also tells if the parabola is wider ( IaI < 1) or narrower ( IaI > 1)
6-6A Example k = 1 the graph moves up one h = -3 the graph moves three to the left a = 2 the graph is narrower and opens upward Predict the shape of the parabola y = 2 (x+3)2 + 1 and graph it on a graphing calculator to check your answer.
6-6A Problem • Predict the shape of y = (x + 2)2 + 1 and graph the equation on a graphing calculator. 1) Moved up one and two to the left
6-6 Analyzing Graphs of Quadratic Functions • For more information on figuring out the shape of graphs see the notes on 6-6A • The equation y = a (x – h)2 + k gives the vertex (h, k) and the axis of symmetry is x = h • You can write the equation of a parabola if you know its vertex or if you know three points the parabola passes through
6-6 Examples • Write y = x2 + 6x – 3 in standard form and then name the vertex, axis of symmetry ,and direction of opening. y = x2 + 6x – 3 y + 3 + o = (x2 + 6x + o) y + 3 + 9 = (x2 + 6x + 9) y + 12 = (x + 3)2 y = (x + 3)2 – 12 Vertex: (-3, -12) Axis of Symmetry: x = -3 The graph should open upwards.
6-6 Examples (cont.) • Given the points (0, 1) (2, -1) and (1, 3) write the equation of the parabola. Substitute the points into the equation y = ax2 + bx + c: (0, 1): 1 = a(0)2 + b (0) + c 1 = c (2, -1): -1 = a (2)2 + b (2) + c -1 = 4a + 2b + c (1, 3): 3 = a(1)2 + b (1) + c 3 = a + b + c Plug in c = 1 for the other two equations: -1 = 4a + 2b + 1 -2 = 4a + 2b 3 = a + b + 1 2 = a + b
6-6 Examples (cont.) Now solve the system of equations: -2 = 4a + 2b 2 = a + b a = 2 – b a = 2 – b -2 = 4 (2 – b) + 2b a = 2 – 5 -2 = 8 – 4b + 2b a = -3 -2 = 8 – 2b -10 = -2b a = -3 b = 5 c = 1 b = 5 The equation is y = -3x2 + 5x + 1.
6-6 Problems • Write y = x2 – 6x + 11 in the form y = a (x – h)2 + k and find the vertex, axis of symmetry, and direction of opening. • Find the equation of the parabola that passes through (0, 0), (2, 6) and (-1, 3). Then graph the function. • y = (x – 3)2 + 2 vertex: (3, 2) axis of symmetry: x = 3 opens upward • y = 2x2 - x Graph of #2
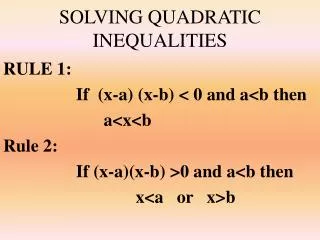
6-7 Graphing and Solving Quadratic Equations • The graph of the parabola serves as a boundary between the area inside the parabola and the area outside the parabola • Graph quadratic inequalities the same way you graph linear inequalities: • Graph the parabola and decide if the boundary line should be solid (≤ or ≥) or dashed ( < or >) • Test one point inside the parabola and one outside the parabola • Shade the region where the inequality was true for the tested points • To solve a quadratic inequality you could graph it or find it through factoring the inequality and testing points
6-7 Examples • Graph the quadratic inequality y > 3x2 + 12x. Then decide if (2,4) is a solution to the inequality. Decide where to shade: Test: (0,0) Test: (-2, 2) 0 > 3 (0)2 + 12 (0) 2 > 3 (-2)2 + 12 (-2) 0 > 0 + 0 2 > 3 (4) – 24 0 > 0 2 > -12 False True Is (2, 4) a solution? 4 > 3 (2)2 + 12(2) You could also look at the graph and see that 4 > 12 + 24 (2,4) is not in the shaded region. 4 > 36 (2, 4) is not a solution.
6-7 Examples (cont.) • Solve x2 – 16 < 0. (x – 4)(x + 4) = 0 x = 4 and x = -4 Test in each region so lets choose x = -5, x = 0, and x = 5. Test: x = -5 Test: x = 0 Test: x = 5 (-5)2 – 16 < 0 (0)2 – 16 < 0 (5)2 – 16 < 0 25 – 16 < 0 0 – 16 < 0 25 – 16 < 0 9 < 0 -16 < 0 9 < 0 False True False The solution is -4 < x < 4. -4 4
6-7 Problems • Graph the quadratic inequality y > x2 – x + 10 and decide if (0, 12) is a solution of the inequality. • Solve x2 – 10x – 16 < 0. (0, 12) is a solution. 1) 2) 2 < x < 8
6-8 Integration: Statistics- Standard Deviation • Standard deviation tells how spread out the values are in a set of data (given symbol σ) • The mean is the average of your data ( symbol x ) • Usually a graphing calculator is used to calculate the standard deviation Standard Deviation (x1 – x)2 + (x2 – x)2 + … + (xn – x)2 n =
6-8 Example Calculate the mean and standard deviation of {3, 5, 6, 7, 9, 11, 22}. 3 + 5 + 6 + 7 + 9 + 11 + 22 7 = 9 Mean = Standard Deviation (3 – 9)2 + (5 – 9)2 + … + (22 - 9)2 7 = = 5.8
6-8 Problem • Calculate the mean and standard deviation of {3, 5, 2, 6, 5, 9}. 1) Mean = 5 Standard Deviation = 6 or 2.45
6-9 Integration: Statistics – Normal Distribution • A normal distribution curve shows the frequency (how many times something occurs) in a symmetric graph • It is often called a bell-curve because it resembles a bell • Normal Distributions have the following properties: • The graph is the highest at the mean • The mean, median, and mode are equal • Data is symmetrical about the mean
3 σ 2 σ 1 σ 1 σ 2 σ 3 σ 6-9 Integration: Statistics – Normal Distribution • For a Normal Distribution curve: • 68% of the values fall within one standard deviation • 95% of the values fall within two standard deviations • 99% of the values fall within three standard deviations
41 44 53 56 59 47 50 2.5% 95% 2.5% 6-9 Example • A battery has an average life span of 50 hours, with a standard deviation of 3 hours. The life span of the batteries is normally distributed. a) What percent of batteries last at least 44 hours? 97.5% of batteries last at least 44 hours. b) If we have 1500 batteries, how many batteries are within one standard deviation of the mean? 68% of batteries are within one standard deviation. (1500)(0.68) = 1020 1020 batteries are within one standard deviation.