Download
1 / 1
10 likes | 89 Views
JP8.1. Web-based near real-time SST quality monitor (SQUAM) for NESDIS AVHRR SST products Prasanjit Dash 1,2 , Alexander Ignatov 1 , Yury Kihai 1,4 , John Sapper 3 , XingMing Liang 1,2 1 NOAA/NESDIS/STAR; 2 Colorado State University- CIRA; 3 NOAA/NESDIS/OSDPD ; 4 Perot Systems.

E N D
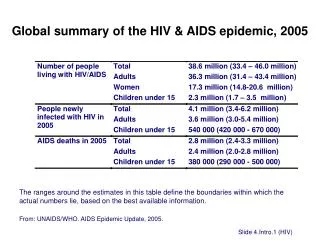
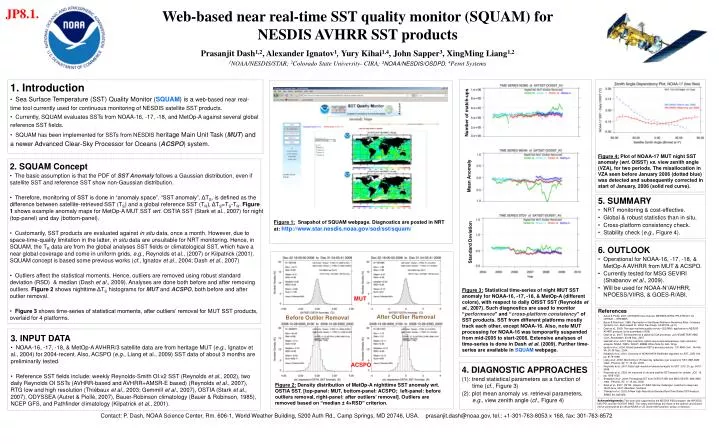
JP8.1. Web-based near real-time SST quality monitor (SQUAM) for NESDIS AVHRR SST products Prasanjit Dash1,2, Alexander Ignatov1, Yury Kihai1,4, John Sapper3, XingMing Liang1,2 1NOAA/NESDIS/STAR; 2Colorado State University- CIRA; 3NOAA/NESDIS/OSDPD;4Perot Systems • 1. Introduction • Sea Surface Temperature (SST) Quality Monitor (SQUAM) is a web-based near real-time tool currently used for continuous monitoring of NESDIS satellite SST products. • Currently, SQUAM evaluates SSTs from NOAA-16, -17, -18, and MetOp-A against several global reference SST fields. • SQUAM has been implemented for SSTs from NESDIS heritage Main Unit Task (MUT) and a newer Advanced Clear-Sky Processor for Oceans (ACSPO) system. Number of match-ups Figure 4: Plot of NOAA-17 MUT night SST anomaly (wrt. OISST) vs. view zenith angle (VZA), for two periods. The misallocation in VZA seen before January 2006 (dotted blue) was detected and subsequently corrected in start of January, 2006 (solid red curve). Mean Anomaly • 2. SQUAM Concept • The basic assumption is that the PDF of SST Anomaly follows a Gaussian distribution, even if satellite SST and reference SST show non-Gaussian distribution. • Therefore, monitoring of SST is done in “anomaly space”. “SST anomaly”, ΔTS, is defined as the difference between satellite-retrieved SST (TS) and a global reference SST (TR), ΔTS=TS-TR. Figure 1 shows example anomaly maps for MetOp-A MUT SST wrt. OSTIA SST (Stark et al., 2007) for night (top-panel) and day (bottom-panel). • Customarily, SST products are evaluated against in situ data, once a month. However, due to space-time-quality limitation in the latter, in situ data are unsuitable for NRT monitoring. Hence, in SQUAM, the TR data are from the global analyses SST fields or climatological SST, which have a near global coverage and come in uniform grids, e.g., Reynolds et al., (2007) or Kilpatrick (2001). SQUAM concept is based some previous works (cf., Ignatov et al., 2004; Dash et al., 2007) • Outliers affect the statistical moments. Hence, outliers are removed using robust standard deviation (RSD) & median (Dash et al., 2009). Analyses are done both before and after removing outliers. Figure 2 shows nighttime ΔTS histograms for MUT and ACSPO, both before and after outlier removal. • Figure 3 shows time-series of statistical moments, after outliers’ removal for MUT SST products, overlaid for 4 platforms. • 5. SUMMARY • NRT monitoring & cost-effective. • Global & robust statistics than in situ. • Cross-platform consistency check. • Stability check (e.g., Figure 4). Figure 1: Snapshot of SQUAM webpage. Diagnostics are posted in NRT at:http://www.star.nesdis.noaa.gov/sod/sst/squam/ Standard Deviation • 6. OUTLOOK • Operational for NOAA-16, -17, -18, & MetOp-A AVHRR from MUT & ACSPO. • Currently tested for MSG SEVIRI (Shabanov et al., 2009). • Will be used for NOAA-N’/AVHRR, NPOESS/VIIRS, & GOES-R/ABI. Figure 3: Statistical time-series of night MUT SST anomaly for NOAA-16, -17, -18, & MetOp-A (different colors), with respect to daily OISST SST (Reynolds et al., 2007). Such diagnostics are used to monitor “performance” and “cross-platform consistency” of SST products. SST from different platforms mostly track each other, except NOAA-16. Also, note MUT processing for NOAA-16 was temporarily suspended from mid-2005 to start-2006. Extensive analyses of time-series is done in Dash et al. (2009). Further time-series are available in SQUAM webpage. MUT • References • Autret & Piollé, 2007; ODYSSEA User manual, MERSEA-WP02-IFR-STR-001-1A, CERSAT – IFREMER. • Bauer & Robinson, 1985; Description of the Bauer-Robinson Numerical Atlas.Compass Systems, Inc., 4640 Jewell St., #204, San Diego, CA 92109, pp.13. • Dash et al., 2009; The near real-time quality monitor (SQUAM): application to NESDIS AVHRR products (to be submitted in RSE) • Dash et al., 2007; Development of a global QC/QA processor. Joint EUMETSAT/AMS Conf., Amsterdam, 23-28 Sep., 2007. • Gemmill et al., 2007: Daily real-time, global sea surface temperature- high-resolution analysis: NOAA / NWS / NCEP / MMAB Office Note Nr.260, 39 pp • Ignatov et al., 2004; Global operational SST & aerosol products. 13th AMS Conf., Norfolk, VA, 20-24 Sep., 2004. • Kilpatrick et al., 2001; Overview of NOAA/NASA Pathfinder algorithm for SST. JGR, 106, pp. 9179-9198. • Liang et al., 2009; Monitoring of IR clear-sky radiances over oceans for SST. 89th AMS meet., Phoenix, AZ, 11-15 Jan, 2009. • Reynolds et al., 2007; Daily high-resolution blended analysis for SST. JOC, 20, pp. 5473-5496. • Reynolds et al., 2002; An improved in situ and satellite SST analysis for climate. JOC, 15, pp. 1609-1625. • Shabanov et al., 2009; Prototyping SST from GOES-R ABI with MSG SEVIRI. 89th AMS meet., Phoenix, AZ, 11-15 Jan, 2009. • Stark et al., 2007; OSTIA. Oceans 07 IEEE, Marine challenges: coastline to deep sea. 18-22 June, 2007, Aberdeen, Scotland. • Thiébaux et al., 2003; A New High-Resolution Blended Real-Time Global SST Analysis. BAMS, 84, 645-656. After Outlier Removal Before Outlier Removal • 3. INPUT DATA • NOAA-16, -17, -18, & MetOp-A AVHRR/3 satellite data are from heritage MUT (e.g., Ignatov et al., 2004) for 2004-recent. Also, ACSPO (e.g., Liang et al., 2009) SST data of about 3 months are preliminarily tested. • Reference SST fields include: weekly Reynolds-Smith OI.v2 SST (Reynolds et al., 2002), two daily Reynolds OI SSTs (AVHRR-based and AVHRR+AMSR-E based) (Reynolds et al., 2007), RTG low and high resolution (Thiébaux et al., 2003; Gemmill et al., 2007), OSTIA (Stark et al., 2007), ODYSSEA (Autret & Piollé, 2007), Bauer-Robinson climatology (Bauer & Robinson, 1985), NCEP GFS, and Pathfinder climatology (Kilpatrick et al., 2001). ACSPO 4. DIAGNOSTIC APPROACHES (1): trend statistical parameters as a function of time (cf., Figure 3) (2): plot mean anomaly vs. retrieval parameters, e.g., view zenith angle (cf., Figure 4) Figure 2: Density distribution of MetOp-A nighttime SST anomaly wrt. OSTIA SST. [top-panel: MUT, bottom-panel: ACSPO; left-panel: before outliers removal, right-panel: after outliers’ removal]. Outliers are removed based on “median ± 4×RSD” criterion. Acknowledgments:This work was supported by the NESDIS PSDI program, the NPOESS IGS IPO, and the GOES-R AWG. The views and findings are those of the authors and should not be construed as an official NOAA or US Government position, policy, or decision. Contact: P. Dash, NOAA Science Center, Rm. 606-1, World Weather Building, 5200 Auth Rd., Camp Springs, MD 20746, USA. prasanjit.dash@noaa.gov, tel.: +1-301-763-8053 x 168, fax: 301-763-8572