Download
1 / 1
10 likes | 186 Views
1. Normal AMOC. The Atlantic meridional overturning circulation: modes of variability and climate impacts. Alexey V. Fedorov and Les Muir Dept. Geology and Geophysics, Yale University. 2. Strong AMOC. Alexey.Fedorov @ yale.edu.

E N D
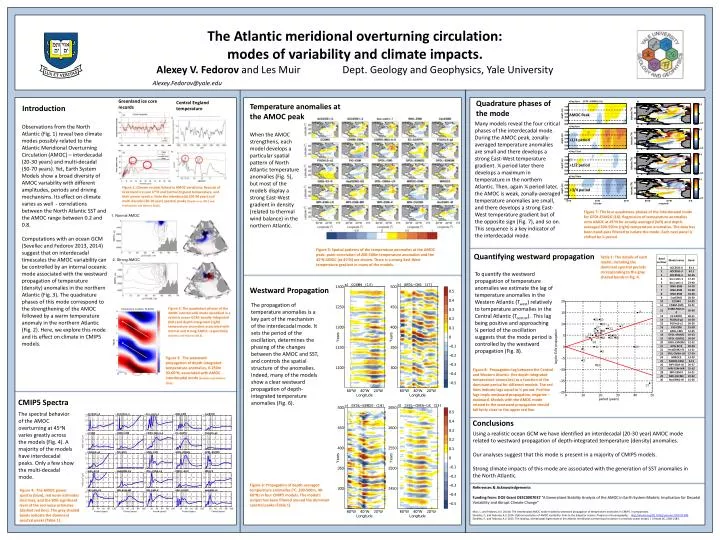
1. Normal AMOC The Atlantic meridional overturning circulation: modes of variability and climate impacts.Alexey V. Fedorovand Les Muir Dept. Geology and Geophysics, Yale University 2. Strong AMOC Alexey.Fedorov@yale.edu Observations of north Atlantic Ocean temperature, both SST and depth integrated show a possible 20-30 year peak in variability believed to be related to the AMOC. Strong AMOC Quadrature phases of the mode Temperature anomalies at the AMOC peak Greenland ice core records Introduction AMOC Peak Many models reveal the four critical phases of the interdecadal mode. During the AMOC peak, zonally-averaged temperature anomalies are small and there develops a strong East-West temperature gradient. ¼ period later there develops a maximum in temperature in the northern Atlantic. Then, again ¼ period later, the AMOC is weak, zonally-averaged temperature anomalies are small, and there develops a strong East-West temperature gradient but of the opposite sign (Fig. 7), and so on. This sequence is a key indicator of the interdecadal mode. Observations from the North Atlantic (Fig. 1) reveal two climate modes possibly related to the Atlantic Meridional Overturning Circulation (AMOC) – interdecadal (20-30 years) and multi-decadal (50-70 years). Yet, Earth System Models show a broad diversity of AMOC variability with different amplitudes, periods and driving mechanisms. Its effect on climate varies as well - correlations between the North Atlantic SST and the AMOC range between 0.2 and 0.8. Computations with an ocean GCM (Sevellec and Fedorov 2013, 2014)suggest that on interdecadal timescales the AMOC variability can be controlled by an internal oceanic mode associated with the westward propagation of temperature (density) anomalies in the northern Atlantic (Fig. 3). The quadrature phases of this mode correspond to the strengthening of the AMOC followed by a warm temperature anomaly in the northern Atlantic (Fig. 2). Here, we explore this mode and its effect on climate in CMIP5 models. Central England temperature When the AMOC strengthens, each model develops a particular spatial pattern of North Atlantic temperature anomalies (Fig. 5), but most of the models display a strong East-West gradient in density (related to thermal wind balance) in the northern Atlantic. +1/4 period +1/2 period Figure 1: Climate records linked to AMOC variations: Records of Greenland ice core δ18O and Central England temperature, and their power spectra. Note the interdecadal (20-30 year) and multi-decadal (50-70 year) spectral peaks (Chylek et al. 2012 and Frankcombe and Dijkstra 2010). +3/4 period Figure 7: The four quadrature phases of the interdecadal mode for GFDL-ESM2G (18). Regression of temperature anomalies onto AMOC at 45oN for zonally-averaged (left) and depth-averaged 200-500m (right) temperature anomalies. The data has been band-pass filtered to isolate the mode. Each next panel is shifted by ¼ period. Figure 5: Spatial patterns of the temperature anomalies at the AMOC peak: point correlation of 200-500m temperature anomalies and the 45oN AMOC (at 45oN) are shown. There is a strong East-West temperature gradient in many of the models. Quantifying westward propagation Table 1: The details of each model, including the dominant spectral periods corresponding to the gray shaded bands in Fig. 4. To quantify the westward propagation of temperature anomalies we estimate the lag of temperature anomalies in the Western Atlantic (Twest) relatively to temperature anomalies in the Central Atlantic (Tcentral). This lag being positive and approaching ¼ period of the oscillation suggests that the mode period is controlled by the westward propagation (Fig. 8). Westward Propagation The propagation of temperature anomalies is a key part of the mechanism of the interdecadal mode. It sets the period of the oscillation, determines the phasing of the changes between the AMOC and SST, and controls the spatial structure of the anomalies. Indeed, many of the models show a clear westward propagation of depth-integrated temperature anomalies (Fig. 6). Figure 2: The quadrature phases of the AMOC interdecadal mode identified in a realistic ocean GCM: zonally-integrated (left) and depth-integrated (right) temperature anomalies associated with normal and strong AMOC, respectively (Sevellec and Fedorov 2013). Figure 3: The westward propagation of depth-integrated temperature anomalies, 0-250m 30-60oN, associated with AMOC interdecadal mode (Sevellec and Fedorov 2013). Figure 8: Propagation lag between the Central and Western Atlantic (for depth-integrated temperature anomalies) as a function of the dominant period for different models. The red lines indicate lags equal to ¼ period. Positive lags imply westward propagation, negative – eastward. Models with the AMOC mode related to the westward propagation should fall fairly close to the upper red line. CMIP5 Spectra The spectral behavior of the AMOC overturning at 45oN varies greatly across the models (Fig. 4). A majority of the models have interdecadal peaks. Only a few show the multi-decadal mode. Conclusions Using a realistic ocean GCM we have identified an interdecadal (20-30 year) AMOC mode related to westward propagation of depth-integrated temperature (density) anomalies. Our analyses suggest that this mode is present in a majority of CMIP5 models. Strong climate impacts of this mode are associated with the generation of SST anomalies in the North Atlantic. Figure 6: Propagation of depth-averaged temperature anomalies (oC, 200-500m, 40-60oN) in four CMIP5 models. The model’s output has been filtered around the dominant spectral peaks (Table 1). References & Acknowledgements Funding from: DOE Grant DESC0007037 “A Generalized Stability Analysis of the AMOC in Earth System Models: Implication for Decadal Variability and Abrupt Climate Change” Muir, L. and Fedorov, A.V. 2014b: The interdecadal AMOC mode related to westward propagation of temperature anomalies in CMIP5. In preparation. Sévellec, F., and Fedorov, A.V. 2014: Optimal excitation of AMOC variability: links to the Subpolar oceans. Progress in Oceanography; http://dx.doi.org/10.1016/j.pocean.2014.02.006 Sévellec, F., and Fedorov, A.V. 2013: The leading, interdecadaleigenmode of the Atlantic meridional overturning circulation in a realistic ocean model. J. Climate 26, 2160-2183. Figure 4: The AMOC power spectra (blue), red noise estimates (red line), and the 90% significant level of the red noise estimates (dashed red line). The grey shaded bands indicate the dominant spectral peaks (Table 1).