Download
1 / 24
250 likes | 411 Views
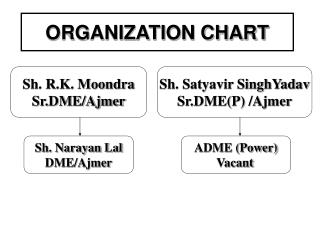
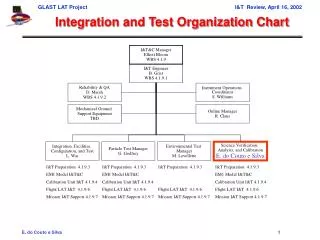
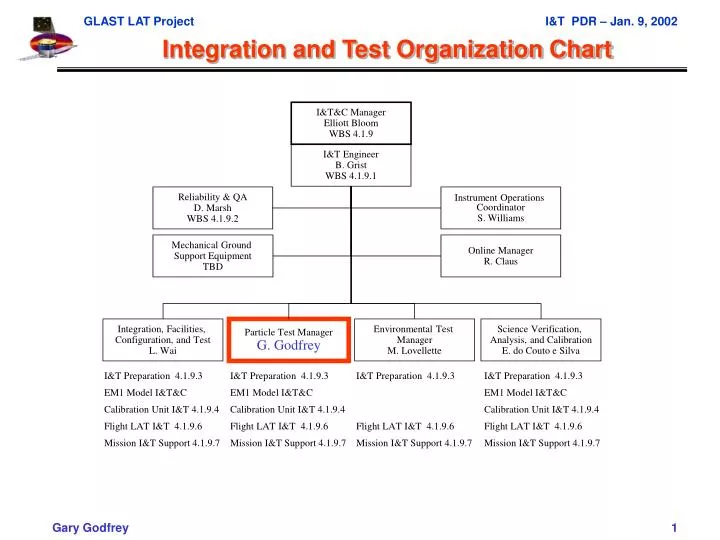
Integration and Test Organization Chart. I&T&C Manager Elliott Bloom WBS 4.1.9. I&T Engineer B. Grist WBS 4.1.9.1. Reliability & QA D. Marsh WBS 4.1.9.2. Instrument Operations Coordinator S. Williams. Mechanical Ground Support Equipment TBD. Online Manager R. Claus.

E N D
Integration and Test Organization Chart I&T&C Manager Elliott Bloom WBS 4.1.9 I&T Engineer B. Grist WBS 4.1.9.1 Reliability & QA D. Marsh WBS 4.1.9.2 Instrument Operations Coordinator S. Williams Mechanical Ground Support Equipment TBD Online Manager R. Claus Integration, Facilities, Configuration, and Test L. Wai Particle Test Manager G. Godfrey Environmental Test Manager M. Lovellette Science Verification, Analysis, and Calibration E. do Couto e Silva I&T Preparation 4.1.9.3 EM1 Model I&T&C Calibration Unit I&T 4.1.9.4 Flight LAT I&T 4.1.9.6 Mission I&T Support 4.1.9.7 I&T Preparation 4.1.9.3 EM1 Model I&T&C Calibration Unit I&T 4.1.9.4 Flight LAT I&T 4.1.9.6 Mission I&T Support 4.1.9.7 I&T Preparation 4.1.9.3 Flight LAT I&T 4.1.9.6 Mission I&T Support 4.1.9.7 I&T Preparation 4.1.9.3 EM1 Model I&T&C Calibration Unit I&T 4.1.9.4 Flight LAT I&T 4.1.9.6 Mission I&T Support 4.1.9.7
Verification Matrix • Requirements flow down from • LAT Science Requirements Document – Level II Specification LAT-SS-00010-1 (found in LAT-SS-9.1) • Summarized by the Instrument Scientist (Steve Ritz)
What Calibration Means • Low level calibration • Parameters are directly calculated from the data • ADC chan / MeV response of each CsI crystal • Which strips are dead in the tracker • Timing accuracy • Calibrate the GLAST Monte Carlo Simulation • Record LAT data for many particle types (e,p,g), energies (20 MeV to 300 Gev), angles of incidence (θ,φ), and positions (x,y,z) of entry. • Compare data to simulated events and modify simulation if needed. • Demonstrate compliance with the higher level science requirements using the calibrated simulation • Effective area as a function of energy. • Point spread function versus energy and zenith angle.
Particle Beam Sources • Cosmics rays on the ground • All individual towers and the full LAT • Van de Graff (17.6 MeV g) • EM tower + 4 towers of calib unit + only known energy g into full LAT • SLAC End Station A positrons (6 days) (1-45 GeV) • Four tower calibration unit • Calibrate energy response • SLAC End Station A photons (15 days) • Four tower calibration unit • Verify MC simulation to measure PSFs and effective areas • SLAC End Station A protons (30 days) • Four tower calibration unit • Verify MC simulation to measure proton rejection • Cosmic rays in airplane (25,000 - 35,000 feet) (few hours) • Full LAT • End-to-end test (e.g. verify DAQ and software filtering ability to handle orbital rates).
Ground Cosmics • Each tower as it becomes available at SLAC • ~106 muons @ ~20 Hz x 1 day (use 3 in-a-row tracker trigger) • Natural cosmic solid angle distribution. No muon telescope. • Four Tower Calibration Unit • Full LAT • ~108 muons @ ~300 Hz x 4 days (using 3 in-a-row tracker trigger) • Calibrate individual CsI xtals • ADC chans/MeV • Positional dependence • Calibrate tracker • Dead and noisy strip map • Straight tracks survey relative tray and tower positions • Calibrate ACD • ADC chans / MeV • Calibrate discriminator thresholds • Efficiency vs position • Trigger and DAQ • Search for problems • Efficiency vs position
Van de Graff • (450 keV) P + Li7 Be8(1+)* Be8 + (17.6 MeV) (~1 Hz into 2p sr) • EM tower and qualification towers • Calibrate energy response and resolution • 104 photons/tower @ .1 Hz x 1day • Full LAT • Only known energy g the full LAT DAQ will see before orbit Xtal Ball spectrum. Sum of 37 NaI xtals. ~1800 g in the 17.6 MeV peak. It’s 7% FWHM is due to the resolution of the detector. The bump at ~12 MeV is due to a broad excited state.
Measurement Strategy • First, calibrate Four Tower Calibration Unit energy response • 1–45 Gev e+ with variety of x,y,θ (6 days) (small extrapolation to g with MC) • .1, .2, .5, 1, 2, 5, 10, 30 Coherent brems g peaks, norm incidence ( 3 days) • 20 and 50 MeV channeling radiation g peaks, norm incidence (2 days) • 17.6 MeV g from Van de Graff • Second, take photon data for calibrating the simulation. • Bremsstrahlung g beam at one e+ energy (30 Gev) ( 10 days) • Simultaneously measures all g energies from 20 Mev to 30 GeV • Bremsstrahlung spectrum has equal numbers of g per % width energy bin. • The already energy calibrated LAT bins the photons into ±25% energy bins. • An example of bin edges= [GeV] • .017, .026, .038, .057, .086, .19, .29, .44, .65, .98, 1.5, 2.2, 3.3, 5.0, 7.4, 11, 17, 25 GeV • Third, take hadron data for calibrating the simulation and measuring the pattern cut rejection factor. • ~200 K protons @ .0044 /pulse x 30 Hz x 30 days x .58 accelerator efficiency • This is the number of protons we recorded in 30 days in Beamtest 99.
ESA Test Beams and GLAST Calibration UnitBeamtest Jan-Mar, 2004
Runtime Estimate: ESA Coherent Brem Calculation (Peter Bosted) of g spectrum for four different beam energies and diamond crystal angles.
Brems Beam Measurements of PSF and Effective Area (Photons / Pulse vs. Photon Pollution) • Average number of photons / pulse =1 maximizes the Poisson probability of exactly 1 photon in the pulse, but: • Sometimes 2 g/pulse (e.g.: 20 MeV + 980 MeV). PSF can’t tell which converted. • If the 980 MeV g converts we measure the correct 1 Gev PSF. • If the 20 MeV g converts we put tails on the 1 GeV PSF • Calculation for 30 Gev positron beam and two # g/pulse (1 and .13) • Brems g’s detectable 20 MeV to 30 GeV, ±25% calorimeter energy bins • Therefore, trade off # g/pulse (runtime) vs. PSF pollution • Must compare data to an MC simulation that includes the Brems radiator.
Runtime Estimate: ESA Bremsstrahlung Use 30 Gev e+ beam. Choose <ng> to give 22% low energy g pollution for 1 Gev g bin. This is ~same pollution as in Beamtest 99.
Runtime Estimate: Protons • Average of 1 particle/pulse maximizes the exactly 1 particle pulses. • Beam is mostly positrons and pions. • .0044 protons/pulse were measured in Beamtest ’99. • ~200 K protons = .0044 /pulse x 30 Hz x 30 days x .58 accelerator efficiency. • Choose a variety of x,y,θ. • Full proton rejection = ACD rejection x Pattern cut rejection • Expect pattern cut rejection of 102-3 to get full rejection of 105-6. • Ignore the ACD (otherwise the scintillator will reject ~all the protons!) • Only measure the pattern cut rejection factor and validate the MC
Alt [feet] L1T [Hz] Notes 0 25 Ground 25,000 540 Same rate as in orbit 35,000 900 Airplane flight 50,000 1175 Pfotzer max 127,000 540 ~Orbital rate End-to-End Test in Airplane (using Cosmic Rays) • Full LAT in an airplane (during airplane ride to NRL environmental test) • L1T trigger rate measured in single tower during Balloon Flight • At 25,000 feet verify the flight hardware at orbital L1T rates • The BFEM was 1/25 of a full LAT. Scales by MC to ~17 x 540 = 9.2 kHz of L1T. • DAQ doesn’t crash • Software filter handles the rate and produces the expected downlink rate • Livetime is accurately measured • At 35,000 feet test the flight hardware at > orbital L1T rates • ~22 kHz saturates the LAT trigger • DAQ should not crash
ESA Channeling Radiation • Positron bounces back and forth between two lattice planes in a xtal. • Graphs below are for 6 Gev positron beam on a 50 um thick diamond xtal. • .0029 g / e+ in the third plot’s peak • Only ~.0001 g/ positron pollution of peak from bremsstrahlung (if e+ channels) • Possible problem: Angular divergence of secondary e+ beam is larger than the channel’s acceptance. The many e+ that don’t channel will just cause brems background.
ESA Channeling Radiation • Measurements made at SLAC in 1979 (Ted Fieguth, etal. JETP Lett. 29, 723 (1979)) 4 Gev e+ Avrg 1 e+/pulse Diamond 011 plane 10 Gev e+ Avrg 1 e+/pulse Diamond 011 plane .007 rad lengths (dN / dEg) x 105 per e+ Eg x (dN / dEg) per e+ per rad length 0 400 Mev
LAT Shipping Box Features • Capabilities already present from taking cosmics in Bldg 33. • Mechanical support points on grid • Liquid cooled heat exchangers bolted to grid radiator surfaces • Portable 1-2 Kw liquid chiller (<0° C for SLAC pre-thermal-vac tests?) • Pseudo solid state recorder on the 30 Mbit/sec data cable • Cat 5 cable to the GSE computer (=Laptop computer in plane) • LAT runs on 28vdc • New shipping box features • Shock mounts to support points on grid • Box thermal insulation so elec power + chiller stabilizes temperature • MicroDAQ (3 of them) Monitors (Temp,Press,Hum,3 axises accel) • Flow dry nitrogen to keep humidity low • DAQ philosophy (like Balloon flight) • Turn on 28 v power and LAT comes up recording data in a preset config. • Laptop is for realtime voltage, current, environmental monitoring • Laptop is for limited “mission creep” (few commands, event display,..?) • ~No new software beyond existing flight and GSE