Download
1 / 40
400 likes | 590 Views
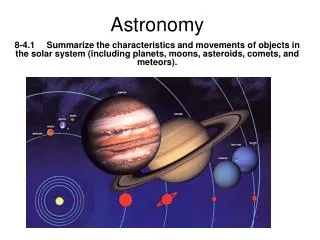
A semi-empirical model for TSI variations Paul Charbonneau (+ Ashley Crouch), Département de Physique, Université de Montréal. Introduction: TSI and solar activity A TSI model based on active region emergence and decay Evidence for a secular trend in TSI

E N D
A semi-empirical model for TSI variationsPaul Charbonneau (+ Ashley Crouch), Département de Physique, Université de Montréal • Introduction: TSI and solar activity • A TSI model based on active region emergence and decay • Evidence for a secular trend in TSI • Evidence for additional cycle-related modulation • Outlook Sofia/Turekian Forum, Yale 28/03/08
Astrophys. J., 677, in press [ 10 April 2008 ] Submitted to Astrophys. J., 17 March 2008 Ashley Paul Geneviève Danahé Sofia/Turekian Forum, Yale 28/03/08
Observed TSI variations Foukal, Fröhlich, Spruit & Wigley 2006, Nature, 443, 161-166 Sofia/Turekian Forum, Yale 28/03/08
Cycle-related TSI variations The solar magnetic activity cycle shows strong amplitude fluctuation and/or intermittency What does TSI do in times of secular rise in activity levels? In Maunder Minimum epoch of suppressed activity? Sofia/Turekian Forum, Yale 28/03/08
Origin of TSI variations Two classes of explanations (NOT mutually exclusive!): Solar irradiance variations reflect the changes in the photospheric coverage of various magnetic structures having different radiative emissivities; 2. On long timescales (> a few yr), TSI variations reflect a deep-seated magnetically-mediated modulation of convective energy transport. Sofia/Turekian Forum, Yale 28/03/08
A TSI model based on the emergence and decay of active regions WHY Oh WHY …? AIM: Produce a model for TSI reconstruction based on simple physical mechanism, rather than statistical correlations; WHY: Belief in the universality of physical laws suggests that such models can be extrapolated more safely outside of the parameter regime in which they were calibrated Sofia/Turekian Forum, Yale 28/03/08
A TSI model based on the emergence and decay of active regions 1. Observational underpinnings 2. Model design 3. Parameter fitting 4. Results for 1978-2007 5. Reconstruction from 1874 6. Long-term trends in quiet-sun irradiance Sofia/Turekian Forum, Yale 28/03/08
Evolutionary link 1: fragmentation Sofia/Turekian Forum, Yale 28/03/08
Evolutionary link 2: boundary erosion Sofia/Turekian Forum, Yale 28/03/08
Emergence+fragmentation+erosion A FRAGMENTATION MODEL: Sunspots of area A injected on « solar disk » (data from Royal Greenwich Observatory data) 2. Backside emergences introduced stochastically 3. Spots fragment stochastically, and erode at boundaries Fragmentation/erosion process eventually produces flux tubes, which then disappear with fixed probability This result in a time-evolving area distribution N(A;t), which can be convolved with the contrast curve, including center-to-limb variations, to produce a TSI time series. Sofia/Turekian Forum, Yale 28/03/08
Observational support The probability distribution function of observed sunspot areas has a lognormal form over more than two orders of magnitude in observed areas; successive fragmentation is known to yield such a distribution (Necessary but not sufficient!) Bogdan et al. 1988, ApJ 327, 451 Sofia/Turekian Forum, Yale 28/03/08
Magnetic flux transport All magnetic structures are carried in the EW direction by (differential) rotation: …and poleward by meridional circulation: Bright, small-scale magnetic elements produced by successive fragmentation and erosion accumulate as a « cloud » surrounding each decaying spot; this is the model’s equivalent to facules (Charbonneau et al. 1999) (Komm et al. 1993) Sofia/Turekian Forum, Yale 28/03/08
From sunspot and facular areas to TSI Basic 3-component model: quiet photosphere, spots, faculae: Irradiance deficit associated with « spots »: (Lean et al. 1998; Brandt et al. 1994) Irradiance excess associated with « faculae » (Chapman & Meyer 1986) Sofia/Turekian Forum, Yale 28/03/08
Model parameters The model involves a number of parameters, some that can be fixed on the basis of observations, others that need to be fitted to the data In practice, 6 to 9 free parameters need to be determined Sofia/Turekian Forum, Yale 28/03/08
Parameter fitting We need to pick model parameter values that produce best-fits to both the TSI and sunspot area (SA) time series (multi-objective optimization) Possible tradeoffs between model parameters make the optimization problem multimodal (secondary extrema) The summed squared residuals between observed and modeled TSI and SA is a statistical function of the model parameters, because of the stochastic nature of the fragmentation process, and statistical treatment of backside emergences: two model runs with the same parameter values will NOT yield the same TSI and SA time series! We use the genetic algorithm-based optimizer PIKAIA, with enhanced elitism and metric-distance-based mutation rate adjustment Sofia/Turekian Forum, Yale 28/03/08
Genetic algorithms (1) A class of biologically-inspired, population-based evolutionary algorithms that can form the core of powerful, flexible multimodal optimization schemes Initialization: build population of random trial solutions; evaluate fitness Select fittest members of the population Breed new population from selected members Evaluate fitness of new population member Is best of current population good enough? DONE! NO YES Sofia/Turekian Forum, Yale 28/03/08
Genetic algorithms (2) ( 0.9876 , 5.4321 ) 0 9 8 7 6 5 4 3 2 1 ENCODE: ( 1.2345 , 6.7890 ) 1 2 3 4 5 6 7 8 9 0 0 9 8 7 6 5 4 3 2 1 0 9 3 4 5 6 7 8 9 0 CROSSOVER: 1 2 8 7 6 5 4 3 2 1 1 2 3 4 5 6 7 8 9 0 MUTATE: 0 9 3 4 5 6 7 8 9 0 0 9 3 4 5 6 1 8 9 0 ( 0.9345 , 6.1890 ) 0 9 3 4 5 6 1 8 9 0 DECODE: ( 1.2876 , 5.4321 ) 1 2 8 7 6 5 4 3 2 1 Sofia/Turekian Forum, Yale 28/03/08
Genetic algorithms (3) FITNESS is defined in terms of the product of mean-squared residuals between the modeled and observed TSI and sunspot area time series: NOTE: No derivatives of fitness w.r.t. model parameters are required We use 81-day running boxcar averages of the time series, to avoid large contribution to the mean-squared residuals associated with timing errors in the emergence of large active regions Sofia/Turekian Forum, Yale 28/03/08
Genetic algorithms (4) Different runs converge at different rates, but eventually reach similar fitness levels Sofia/Turekian Forum, Yale 28/03/08
Results: It Works !! d41_61_0702 Model run Sofia/Turekian Forum, Yale 28/03/08
TSI excess in rising phase RMS(S) = 0.202 W/m2 Modelled TSI is systematically below observations during rising phases of cycles… …even though SA is very well-fitted RMS(A) = 230 microHem Sofia/Turekian Forum, Yale 28/03/08
I mean, it really does !! Bright « facular » component Dark « spot » component Sofia/Turekian Forum, Yale 28/03/08
Optimal parameter values Conversion efficiency high: Nearly all sunspot flux is converted into small scale elements Faculae lifetime high: Obs. Suggest tens of days for large facular structures Facular contrast high: Observational determinations suggest ~ 0.03-0.04 Hint: we are missing an irradiance source unrelated to decay of active regions Sofia/Turekian Forum, Yale 28/03/08
Working back to 1874 Sofia/Turekian Forum, Yale 28/03/08
A TSI downward trend? Allow for linear trend in quiet Sun irradiance: Repeating best-fit procedure with additional slope parameter yields an improved fit: fitness in range 1.62-1.81 as opposed to 1.50-1.67 with constant S_Q. Statistically significant! RMS(S) : 0.202 to 0.193 W/m2 Sofia/Turekian Forum, Yale 28/03/08
Repeating best-fit procedure with additional slope parameter yields an improved fit (fitness in range 1.62-1.81 as opposed to 1.50-1.67 with constant S_Q. Statistically significant! Sofia/Turekian Forum, Yale 28/03/08
Optimal parameter values, bis Sofia/Turekian Forum, Yale 28/03/08
A cyclically varying contribution to TSI? Allow for sinusoidal contribution to quiet Sun irradiance, i.e., unrelated to active region decay: Repeating fit procedure with additional sinusoidal component yields an improved fit: fitness in range 1.82-2.31 as opposed to 1.50-1.67 with constant S_Q. Statistically significant! RMS(S) : 0.202 - > 0.168 W/m2 Sofia/Turekian Forum, Yale 28/03/08
How optimal is optimal? Some runs remain « stuck » on secondary extrema Fittest runs have S_Q In range 0.3-0.6 W/m2 Very few runs converge With S_Q < 0.3 W/m2 Mean +/- 1 s.d. of 100 runs with fixed S_Q 100 best out of 200 GA runs Sofia/Turekian Forum, Yale 28/03/08
Identifying « bad » local optima Because fitting parameters have a direct physical meaning, it is possible to assess the relative merits of globally suboptimal solutions corresponding to local extrema This solution has a reasonable facular contrast (0.045), but very low lifetime for bright small-scale « faculae » elements (9 days) Sofia/Turekian Forum, Yale 28/03/08
Optimal parameter values, coda Sofia/Turekian Forum, Yale 28/03/08
Parameter correlations 1.84 < Fitness < 2.34 1.34 < Fitness < 1.84 0.84 < Fitness < 1.34 Sofia/Turekian Forum, Yale 28/03/08
Conclusions (so far…) • It works !! We can simultaneously fit, and quite well, both sunspot areas and TSI over the 1978-2007 interval • We find evidence for a brightness source unrelated to active regions in the rising phase of cycles 22 and 23 • We find evidence for a slight downward trend in TSI, by -0.0069 +/- 0.0027 W/m^2 per year over 1978-2007 • We find evidence for an cycle-phased irradiance source unrelated to active region emergence and decay, accounting for 40-50% of peak-to-peak TSI cycle variability Sofia/Turekian Forum, Yale 28/03/08
What next? • Introduce and test models for long-term modulation • « Differentiate » bright structures: introduce DLA model for network and faculae formation • Introduce far-side emergences as inferred helioseismically • Use genetic programming to « evolve » better fragmentation algorithms, contrast functions, center-to-limb contrast functions for faculae, etc. • Adapt model for spectral irradiance, with special emphasis on UV range most relevant to atmospheric chemistry • Use output of dynamo model to « feed » sunspot emergences into the TSI model Sofia/Turekian Forum, Yale 28/03/08
Semi-empirical models for long-term modulation of quiet-sun irradiance Quiet-sun TSI based on a 2-component magnetic flux model linked to TSI via the F10.7 radio flux K. Tapping et al. 2007, Sol. Phys., 246, 309 Sofia/Turekian Forum, Yale 28/03/08
DLA model for network formation Piece of MDI quiet-sun magnetogram Numerical simulation [ Crouch, Charbonneau & Thibault, 2007, Astrophys. J., 662, 715 ] Sofia/Turekian Forum, Yale 28/03/08
DLA model for faculae formation [ Kim Thibault, UdeM MSc thesis, 2008, in preparation ] Sofia/Turekian Forum, Yale 28/03/08
FIN Sofia/Turekian Forum, Yale 28/03/08
Parameter correlations Multiple GA-optimizarion runs allow to establish error estimates and correlations between best-fit parameters. Sofia/Turekian Forum, Yale 28/03/08